Aug 15, 2022
As mortgage rates remain elevated relative to 2021 levels but housing supply remains thin, NAHB’s Housing Market Index fell again this month, reaching the lowest level since May of 2020. Last month, the index posted its second largest month over month decline, and following this report, the index has fallen by 18 points over the last two months, the third largest two month decline on record, falling just short of April and May of 2020. Click here to start a two-week trial to Bespoke Premium and receive our paid content in real-time.

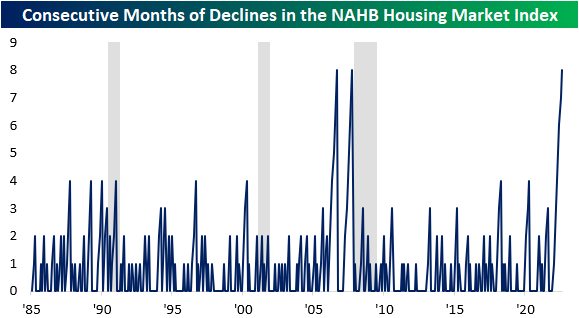
The NAHB Housing Market Index has now declined for eight consecutive months, which is tied for the longest monthly losing streak since the index’s inception in 1985. The only two other periods with an equal number of monthly declines were the eight months ending in October 2007 and before that September 2006. As most Americans remember, these periods were followed by precipitous declines in home values. Interestingly, the NY Post reported that Google searches for “sell my home fast” spiked by 2,750%.
All of the sub-indices within the report fell as well, indicating broad weakness. Apart from Future Sales and sentiment in the Western region, all of the other sub-indices experienced declines that were in the bottom 5th percentile of all periods. However, the current readings are not nearly as negative. Future sales and traffic are in the 18th and 23rd percentile, but the Northeast is still in the 63rd percentile. Although the current readings aren’t as low as the readings leading up to previous recessions, it is difficult to be positive given the current trends.

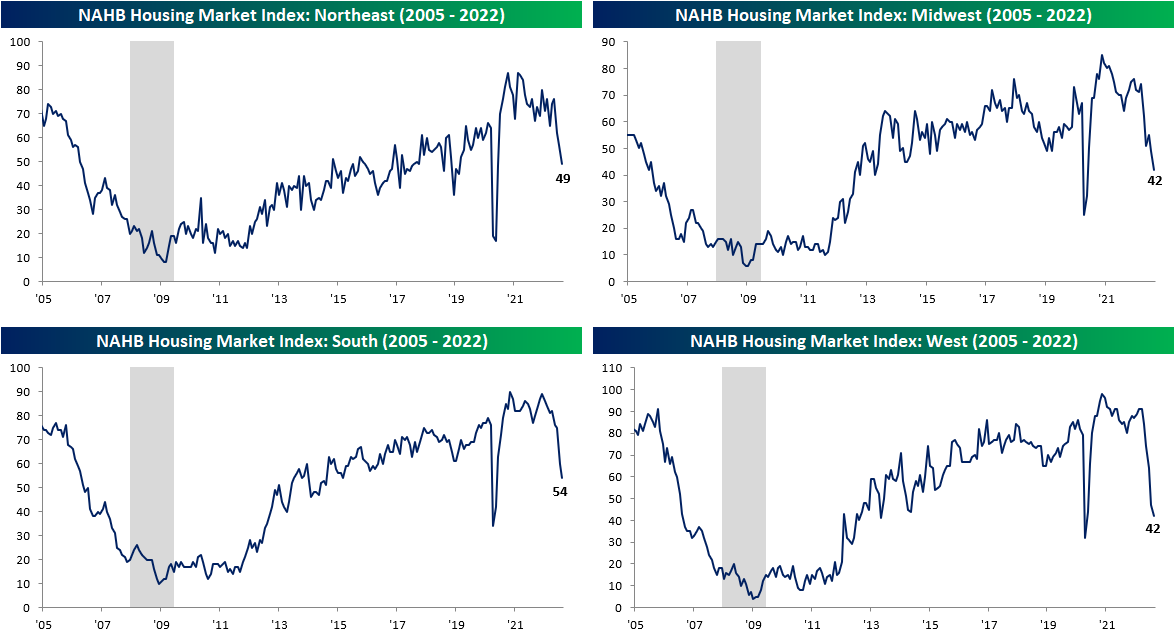
As shown above, no geographic region has been safe from the plunge in sentiment, but the Northeast has held up better than the others. Over the last eight months, the West, South, and Midwest regions have seen their largest eight-month declines in the index on record, while the decline in the Northeast is the third worst on record. Click here to start a two-week trial to Bespoke Premium and receive our paid content in real-time.
The stocks most affected by these trends – homebuilders – struggled during the sustained sell-off between the end of 2021 and mid-June, but have recovered by over 28% relative to the lows. However, the ETF is still down over 22% relative to the highs. The recovery might be due to the fact that much of the negativity has been priced in, historically low valuation multiples, and a pullback in interest rates. The chart below shows the performance of the SPDR S&P Homebuilders ETF (XBH). As you can see, XBH has broken its downtrend and has been moving consistently higher carving out what might be a new uptrend.

May 18, 2022
On the same day that mortgage applications plunged 12% and one day after homebuilder sentiment for the month of May showed a large decline, the latest updates on Housing Starts and Building Permits showed a mixed picture. While economists were expecting both reports to decline, the drop in Housing Starts was more than expected while the decline in Building Permits was slightly less than forecast.
The table below breaks down this month’s report by type of unit and region and shows both the m/m and y/y changes. For Housing Starts, the 0.2% m/m decline was driven entirely by single-family units (-7.3%) while multi-family units surged 15.3%. With respect to Building Permits, we saw a similar breakdown although the disparity wasn’t nearly as large as single-family units dropped 4.6% while multi-family units declined just 1%. On a regional basis, the Northeast and Midwest experienced 20%+ declines on a m/m basis while every region except the South experienced declines in Building Permits.
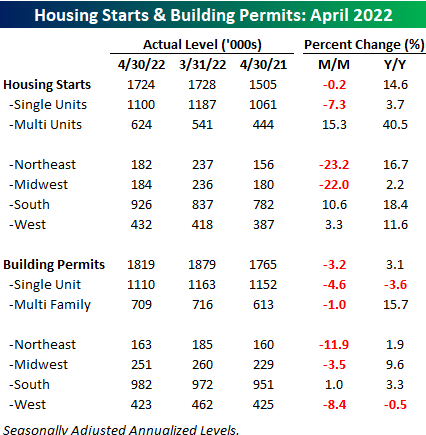
While both Housing Starts and Building Permits declined on a m/m basis, the longer-term trend for both still remains intact. At 1.759 million, the 12-month average of Building Permits came in at the highest level since January 2007 while the 1.659 million average level of Building Permits was the highest since February 2007. Higher interest rates have caused a slowdown in housing at the margin, but longer-term trends have yet to show signs of rolling over. Click here to learn more about Bespoke’s premium stock market research service.

May 17, 2022
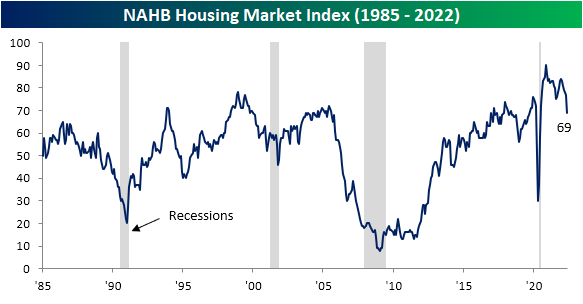
Although material cost pressures have shown some signs of alleviating (for example lumber and copper futures have been grinding lower), the cost to finance a home has only increased with the national average of a 30-year fixed-rate mortgage hovering around 5.5%. That higher cost dampens demand, and homebuilder sentiment has taken a sharp turn lower. The NAHB’s Housing Market Index fell from a top 5% reading of 77 last month all the way down to a new 52-week low of 69 this month. The index has been rolling over for some time now after peaking all the way back in November 2020, and the 8 point month over month decline in May is the worst of that span, ranking as the fourth largest monthly decline in the history of the index. Two of those larger declines came in the midst of recessions/major economic shocks—October 2001 (9/11) and April 2020 (start of the pandemic). The other largest drop was in February 2014.
The big drop in the headline index points to a notable deterioration in reported conditions and similar drops were shared across the sub-indices. Present sales remain the most elevated with its reading of 78 managing to stay in the top decile of its historical range, but just barely so as the 8-point m/m decline also ranks as one of the largest on record. Even though reported sales are holding up decently (albeit far from improving), sentiment for future sales has collapsed. After a double-digit decline this month, the index is below its historical median meaning homebuilders are anticipating activity to slowdown in the coming months. One likely reason is that overall traffic has pulled back sharply. The 9-point month-over-month drop is tied for the second-largest decline on record.

From a geographic standpoint, this month was interesting. As with the national indices, the Midwest and West saw some of the sharpest activity pullbacks in the history of the survey. Those indices are now around similar levels to the spring of 2020. For the South, the decline did not result in an outright collapse below the post-pandemic range, but nonetheless, the decline was enormous by historic standards.
Then there’s the Northeast. While the rest of the country experienced sharp pullbacks, the Northeast index actually rose by 2 points to 76. Although the level remains middling versus its post-pandemic range, it is a notable divergence compared to the rest of the country.

In spite of the report on homebuilder sentiment, homebuilder stocks, as proxied by the iShares US Home Construction ETF (ITB), are actually higher alongside the rest of the market, currently up 1.3%. Those gains on top of the past few days’ rally appear more technical in nature than any sort of improvement in the overall backdrop for the space. As shown below, the group has been hit hard this year as mortgage rates have soared. Hardly at any point this year has the group managed to trade above its moving averages. Click here to learn more about Bespoke’s premium stock market research service.
