Aug 25, 2022
Bespoke’s Little Known Stocks (LIKS) report highlights a company that may not be on the traditional radar of most investors. In this report, we provide an in-depth analysis of the little known stock, including industry insights, growth lever analysis, insights to the competitive landscape, equity performance, relative valuation, operational efficiency, pros & cons, and more. Today’s report is about a company that helps governments and enterprises defend their cyber assets.

As always, this report is for informational purposes only and is not a recommendation to buy or sell any specific securities. Investors should do their own research and/or work with a professional when making investment decisions. Highlighting a stock doesn’t mean we are bullish or bearish on it. Our goal is simply to provide readers with facts to help them make informed decisions rather than just opinions.
Bespoke’s LIKS reports are available at the Bespoke Institutional level only. You can sign up for Bespoke Institutional now and receive a 14-day trial to read our LIKS reports. To sign up, choose either the monthly or annual checkout link below:
Bespoke Institutional – Monthly Payment Plan
Bespoke Institutional – Annual Payment Plan
Jun 29, 2022
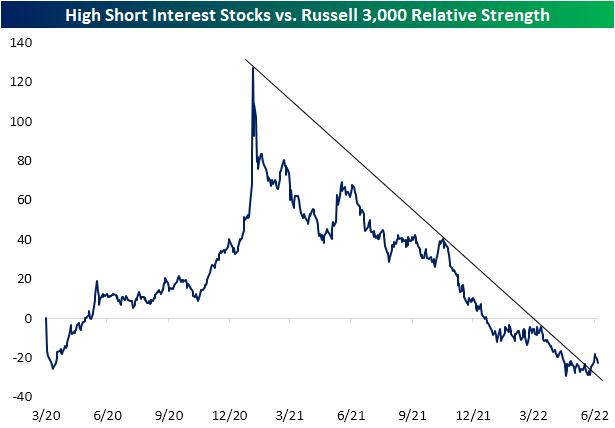
As we highlighted in a post yesterday, the relative strength of the 100 stocks with the highest levels of short interest against the Russell 3000 has broken its downtrend. This downtrend had been in place since the end of the meme stock mania in January of 2021. Just to refresh your memory, that chart is provided below.
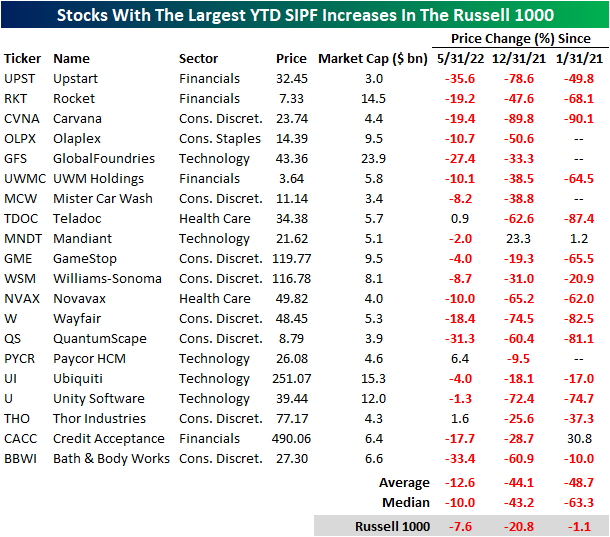
Today, we took a look at the 20 Russell 1000 stocks that have seen the largest increases in short interest as a percentage of float (SIPF) on a year to date basis. Leading this group is Upstart (UPST), the buy now pay later firm that has been decimated as growth stocks have gotten crushed and consumer confidence weakens to historic levels. UPST saw SIPF rise by 27.1 percentage points on a YTD basis and by an additional 2.0 percentage points in June. Notably, UPST appeared on our Top 20 P/S Decliners list as well, which we published yesterday. Unity Software (U) is the only other name to appear on both lists. The largest names on this list by market cap are GlobalFoundries (GFS), Ubiquiti (UI) and Rocket (RKT).

The performance of these twenty names has been quite weak on a month over month and YTD basis. Additionally, these names have massively underperformed the broader index since the end of the meme stock mania, trading down by 48.7% on average (median: -63.3%) compared to the Russell 1000’s loss of just 1.1%. On a YTD basis, these stocks have shed 44.1% of their value on average, which was accelerated by a 12.6% average loss since the end of May. Although it’s difficult to find any positivity in these names, they are primed for short squeezes or reversals as shorts cover their positions (which forces buying. Click here to learn more about Bespoke’s premium stock market research service.
Jun 28, 2022
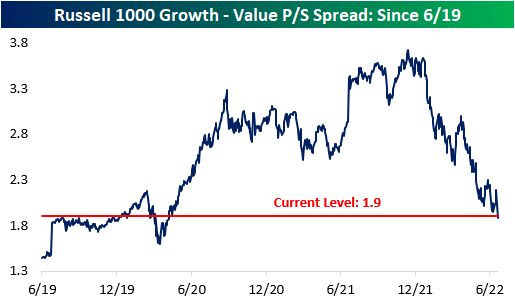
It’s no secret that there has been a massive pullback in valuation multiples, and stocks that had higher multiples have been hit much harder by the recent market pullback. This comes as rate hikes increase the discount rate and the era of “free money” comes to an end, which inherently lowers the risk appetite of investors. The chart below shows the price to sales (P/S) spread between the Russell 1000 growth index and the Russell 1000 value index. Naturally, growth stocks should always trade at higher multiples, but the spread became magnified throughout the pandemic. The spread peaked in mid-November 2021 at 3.7, but it has contracted by 1.8 points to 1.9 as of today’s open. Whereas the growth index has seen its P/S ratio decline by 36.4%, the value index has only seen a P/S decline of 13.0%. The growth index currently has a P/S ratio of 3.6, compared to 1.7 for the value index. The P/S spread between the two indices is now inline with pre-COVID levels, so the stretched growth multiples of the pandemic-era have come full circle. Click here to learn more about Bespoke’s premium stock market research service.
Dissecting this further, we took a look at the 20 Russell 1000 stocks that have seen their P/S multiples compress the most since their respective 52-week highs. Leading this group is Lucid (LCID), which has seen the P/S ratio decline by a whopping 275,309 points. This comes as sales increased substantially and the price declined significantly (-68.2% since the 52-week high). Even still, LCID’s P/S ratio remains in the stratosphere at 359. Next on this list is Norwegian Cruise (NCLH) and Carnival (CCL), which have experienced a similar phenomenon. Sales fell off a cliff for the cruise lines following COVID, causing their P/S ratios to spike. As sales have returned on the re-opening and share prices have continued to decline, P/S ratios have fallen significantly. The largest decliners in share price since their respective 52-week highs on this list are Upstart (UPST), DocuSign (DOCU) and Unity Software (U), which have declined by 90.4%, 79.0% and 78.9%, respectively. Upstart has seen its P/S ratio fall from 37.8 down to 3.0. The median stock on this list trades 10.8 times LTM sales, which is still aggressive to say the least. Most stocks topped out either last summer or in October/November.

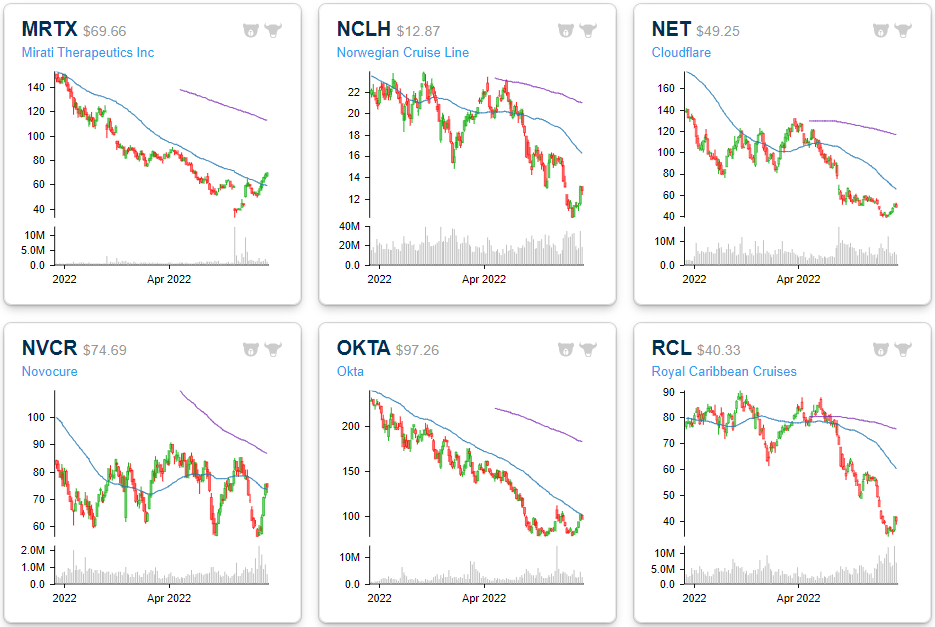
The six month price charts below are available using our Chart Scanner tool. You can click here to view a custom portfolio of these twenty stocks if you’re already a subscriber. As you can see, the vast majority are in sustained downtrends. However, if interest rate pressures subside and risk appetites increase, these twenty names could benefit through multiple expansion. Click here to learn more about Bespoke’s premium stock market research service.


May 19, 2022
Growth stocks outperformed value stocks by a wide margin in the years leading up to the pandemic. Growth also outperformed value in the first ~18 months after the pandemic, but that trend has been flipped on its head since late 2021. You can see the recent convergence between growth and value in the chart below. Entering 2022, the S&P 500 Growth index was outperforming the S&P 500 Value index by ~40 percentage points since the pre-COVID high for the stock market in February 2020. Now, Growth is only outperforming Value by ~8 percentage points.

The shift from growth to value has been even more dramatic in the more economically sensitive small-cap space. Remarkably, the Russell 2,000 Growth index is now DOWN 6% on a total return basis since the pre-COVID peak for stocks on 2/19/20. Six months ago, this index was still up 45% from its pre-COVID high.
Fed Chair Powell first shifted to a tighter monetary stance in November 2021. In just six months since Powell’s pivot, we’ve seen the entire post-COVID bull market for small-caps give up its gains and then some. And this doesn’t even factor in a double-digit percentage point increase in inflation since COVID began that pushes “real” returns for the Russell 2,000 Growth index much deeper into negative territory. Click here to learn more about Bespoke’s premium stock market research service.
