Jul 6, 2022
Investors often turn to Gold as a safe asset in tumultuous times, as the asset tends to hold its value during market downturns. For example, when the S&P 500 sold off by 34.1% during the COVID Crash, the SPDR Gold Trust (GLD) declined just 3.6%. In 2022, GLD initially acted as a strong hedge to the equity market, gaining 1.0% on a YTD basis on June 16th as SPY entered bear market territory. However, GLD topped out in early March and is now trading 14.0% off of its closing 2022 high. GLD has even underperformed SPY since March 8th, declining 14.0% versus SPY’s drop of 8.2%. Click here to learn more about Bespoke’s premium stock market research service.
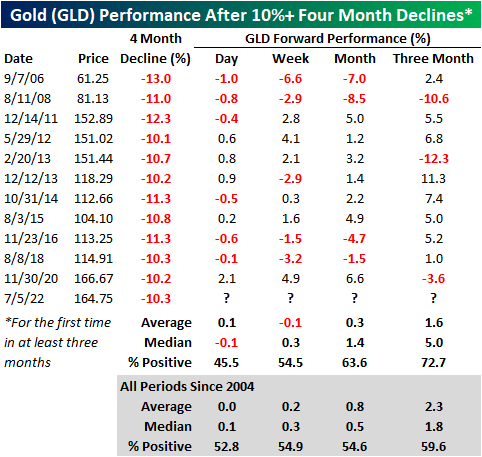
Over the last four months, GLD has declined by 10.3%, which is elevated for a relatively stable asset during a bear market. Since its inception in 2004, GLD has declined 10% or more over a four-month period (with no occurrences in the prior three months) twelve times with each occurrence shown in the chart below.

The forward performance following four-month declines of 10%+ has been mixed depending on the time frame. The next day (which would be today), GLD has booked a median loss of 10 basis points, gaining just 45.5% of the time. However, the median return and positivity rate in the next week is inline with historical averages. Over the one and three months, performance tends to pick back up, registering gains 63.6% and 72.7% of the time, respectively. Over the next three months, GLD has had a median gain of 5.0%, which is more than two and a half times the median of all periods. Click here to learn more about Bespoke’s premium stock market research service.
Jun 15, 2022
Quantitative tightening (QT) has wide-spanning effects on the economy, as it puts upward pressure on risk-free interest rates due to increased supply in debt markets (assuming all else equal). The Fed announced its QT strategy just one meeting (5/3/22) after hiking its target rates for the first time since 2018 back in March. The previous QT cycle in 2017 did not begin until about two years after the Fed first started hiking rates. The reason for the quick turnaround this time around, though, stems from the fact that inflation has been running rampant, and the balance sheets of consumers and corporates are in relatively strong positions.
In terms of how various asset classes may perform in the current period of QT, some investors have looked back to the prior period of QT for insight. As mentioned above, there are some important distinctions between the current period and the last period of QT, so it may not be an apples-to-apples comparison, but there are certainly some similarities that can make knowing what happened back then helpful. Using the price of gold over the last 15 years as a backdrop, the chart below shows key events related to periods of quantitative easing (QE) and QT. The event surrounding each dot is summarized in the table below. Click here to learn more about Bespoke’s premium stock market research service.
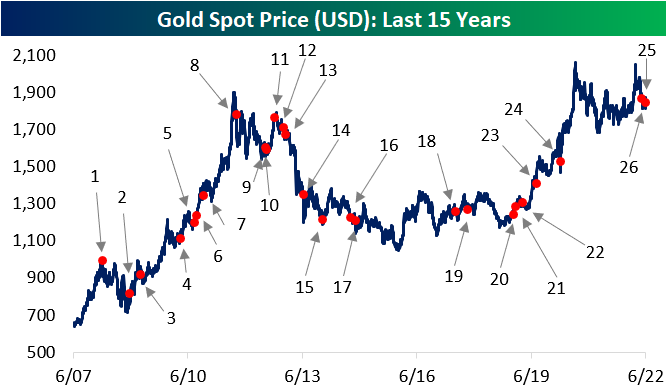

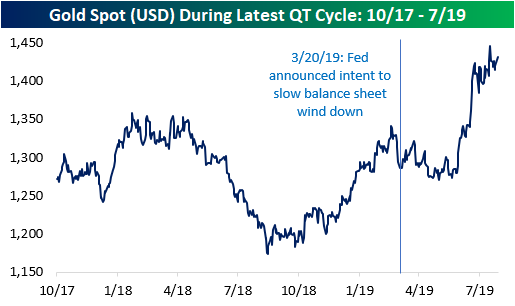
Between October 2017 and July 2019 (the last QT cycle), the price of gold rose by 12.6%, which works out to an annualized return of 6.5%. Over the last 15 years, the price of gold has held an annualized return rate of 6.8%, so there was no clear differentiation in the performance of gold during that period of QT and the last 15 years as a whole. Looking at the chart, though, much of the gains from the last cycle of QT came late in that cycle as the Fed had already announced its intent to end the running off of assets from its balance sheet. In fact, the S&P 500 outperformed gold by more than six percentage points during the last QT cycle. In fact, before the March 2019 announcement that the Fed would wind down its balance sheet, gold was practically unchanged relative to the start of the QT cycle. Click here to become a Bespoke premium member today!
May 11, 2022
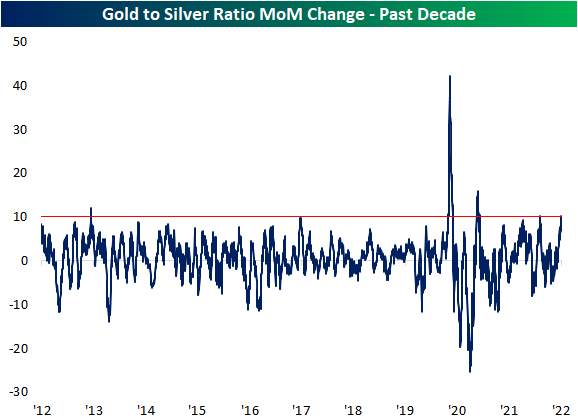
Little has been safe from heavy selling pressures recently including assets normally considered “safe havens” like precious metals. Gold is currently down over 9% from its March high while silver is down roughly 20% since its spring high. Today, both metals are bouncing from notable levels. For gold, it is finding support at its 200-DMA which also coincides with the rough uptrend line of higher lows of the past year. In addition to dramatic underperformance versus gold, silver’s test of support is perhaps a bit shakier. It is well below its moving averages, but today’s rebound is happening right around the lows from September and December. Granted, on an intraday basis, both yesterday and today’s lows breached those levels.

Given silver’s much larger decline, the ratio of gold to silver has ripped higher in the past month. In fact, the ratio has risen over 10% in the past month. The most recent 10% or larger surges were as recent as this past December with two even larger ones in the spring and fall of 2020. Prior to the pandemic, though, these sorts of rapid increases in the gold to silver ratio have been rarer. Before 2020, the only other instances of the past decade were in the springs of 2013 and 2017. Click here to learn more about Bespoke’s premium stock market research service.