Aug 17, 2022
Just as the S&P 500 ran into some resistance yesterday at its 200-day moving average (DMA), we’ve seen the same pattern play out in a number of commodities. Two of the more high-profile ones have been copper and crude oil.
Copper fell out of bed in the late spring and early summer, losing a third of its value. Along with the equity market, copper has seen a late-summer rally, but things came to a screeching halt right at the 50-DMA last Thursday. Copper has been down on two of the last three trading days and hasn’t been able to trade back above that elusive 50-DMA since. Click here to start a two-week trial to Bespoke Premium and receive our paid content in real-time.

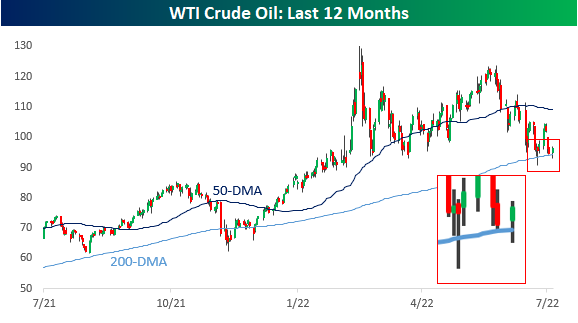
Crude oil has been just as weak as copper lately, trading in a well-defined downtrend and breaking below its 200-DMA in early August. There was a little bit of a bounce last week, but resistance came into play at the 200-DMA, and after making another lower high, it has since made another lower low.
When stock, commodity, bond, or any other asset class is in a well-defined downtrend, the first thing they have to do to break out of their funks is clear resistance at key moving averages like the 50 and/or 200-DMA. In the case of copper and crude, they have both recently come up short. The S&P 500, again, is facing some resistance at its 200-DMA, but at least it has managed to clear its 50-DMA which it did in the second half of July.

Aug 1, 2022
In 2022, extremely elevated gas prices have been impacting the economy, as every product-producing company has seen energy and transportation costs increase, forcing price hikes on the part of businesses simply to keep margins flat. Although there are a variety of factors affecting CPI readings, high gas prices certainly apply upward pressure. Today, gas prices are still extremely elevated compared to historical levels. At the AAA current national average of $4.22, just 1.8% of all days since the start of 2005 have seen a higher national average high, and all of them occurred this year. Click here to learn more about Bespoke’s premium stock market research service.

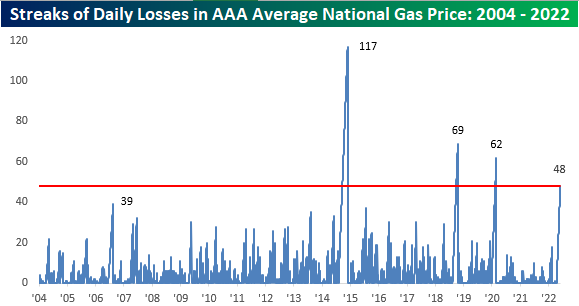
The national average price per barrel is still up 32.75% y/y, but this is actually the smallest y/y increase so far in 2022 and comes as the national average price has declined for 48 consecutive days. That’s the fourth longest streak on record. This streak is certainly notable, but gas prices are still at a level that is wearing on consumers.

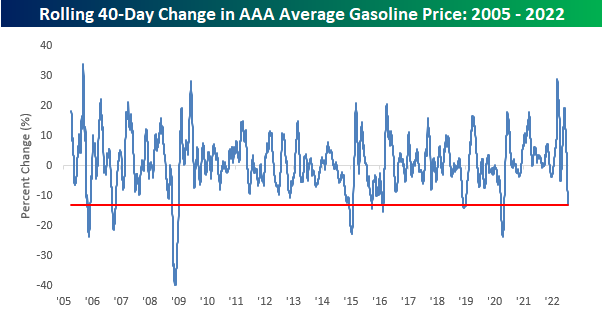
The 40-day rate of change in average gas prices (-15%) has been notable as well, with only six other periods seeing a larger decline on a percentage basis. The most recent occurred during the COVID crash when it became clear that demand was going to deteriorate due to government-imposed mandates across the globe. Consumers will hope for further declines as we begin to near the $4.00 per gallon level. Not only have prices been falling lately, but they have also been more volatile than usual, as the current 50-day standard deviation (26 cents) is 3.2 times higher than the average since 2005. Click here to learn more about Bespoke’s premium stock market research service.

Jul 25, 2022
The price of a gallon of gas, while still up YTD and relative to most other periods in the past, has pulled back considerably and consistently over the last six weeks. While a gallon of gas topped $5 in early to mid-June, over the weekend, the average price was back down to $4.36. The decline in prices has also been consistent as prices have now declined for 41 straight days. Going back to 2005, when AAA began tracking the daily national average price, this current streak now ranks as the fourth-longest on record after surpassing the 39-day streak from September 2006 over the weekend. In order for this current streak to move into the top three and oust the 62-day streak from the COVID crash, we’ll need to see another three weeks of daily declines, and in order to move into first place overall, we’d need to see the current streak nearly triple in length to 118 days and stretch out to early October!

While the current streak of declines is the fourth-longest on record, the magnitude of gasoline’s decline over the last 40 days hasn’t been quite as extreme. At -13%, there have been seven other periods where average prices at the pump experienced a larger decline over the same time period. What is notable, however, is that back in March the 40-day rate of change was the second highest on record trailing only the 33% increase that came in the wake of Hurricane Katrina in September 2005.
In order for prices at the pump to keep declining, we’re going to need oil prices either to stay around current levels or continue declining. Oil prices have obviously been weak for the last month or so, but over the last two weeks have shown some stabilization above the 200-DMA, including two different days when the price dropped below the 200-DMA intraday but bounced. If the 200-DMA holds in the near-term, gas prices are likely to stop declining, so this will be a key level to watch for what will ultimately determine the health of the consumer. Click here to learn more about Bespoke’s premium stock market research service.