Aug 1, 2022
In 2022, extremely elevated gas prices have been impacting the economy, as every product-producing company has seen energy and transportation costs increase, forcing price hikes on the part of businesses simply to keep margins flat. Although there are a variety of factors affecting CPI readings, high gas prices certainly apply upward pressure. Today, gas prices are still extremely elevated compared to historical levels. At the AAA current national average of $4.22, just 1.8% of all days since the start of 2005 have seen a higher national average high, and all of them occurred this year. Click here to learn more about Bespoke’s premium stock market research service.

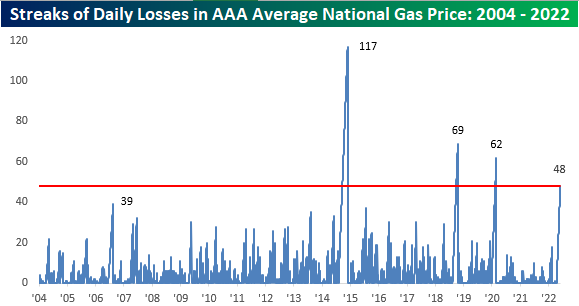
The national average price per barrel is still up 32.75% y/y, but this is actually the smallest y/y increase so far in 2022 and comes as the national average price has declined for 48 consecutive days. That’s the fourth longest streak on record. This streak is certainly notable, but gas prices are still at a level that is wearing on consumers.

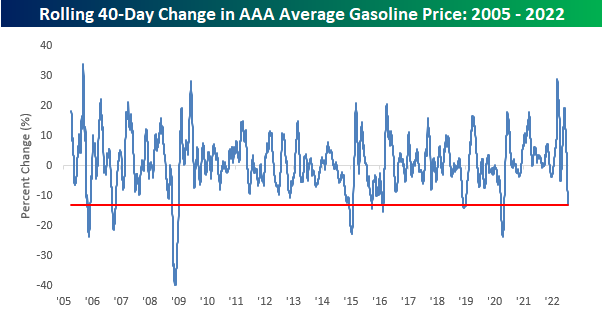
The 40-day rate of change in average gas prices (-15%) has been notable as well, with only six other periods seeing a larger decline on a percentage basis. The most recent occurred during the COVID crash when it became clear that demand was going to deteriorate due to government-imposed mandates across the globe. Consumers will hope for further declines as we begin to near the $4.00 per gallon level. Not only have prices been falling lately, but they have also been more volatile than usual, as the current 50-day standard deviation (26 cents) is 3.2 times higher than the average since 2005. Click here to learn more about Bespoke’s premium stock market research service.

Jul 25, 2022
The price of a gallon of gas, while still up YTD and relative to most other periods in the past, has pulled back considerably and consistently over the last six weeks. While a gallon of gas topped $5 in early to mid-June, over the weekend, the average price was back down to $4.36. The decline in prices has also been consistent as prices have now declined for 41 straight days. Going back to 2005, when AAA began tracking the daily national average price, this current streak now ranks as the fourth-longest on record after surpassing the 39-day streak from September 2006 over the weekend. In order for this current streak to move into the top three and oust the 62-day streak from the COVID crash, we’ll need to see another three weeks of daily declines, and in order to move into first place overall, we’d need to see the current streak nearly triple in length to 118 days and stretch out to early October!

While the current streak of declines is the fourth-longest on record, the magnitude of gasoline’s decline over the last 40 days hasn’t been quite as extreme. At -13%, there have been seven other periods where average prices at the pump experienced a larger decline over the same time period. What is notable, however, is that back in March the 40-day rate of change was the second highest on record trailing only the 33% increase that came in the wake of Hurricane Katrina in September 2005.
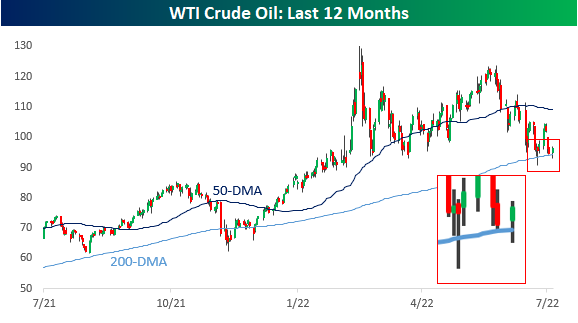
In order for prices at the pump to keep declining, we’re going to need oil prices either to stay around current levels or continue declining. Oil prices have obviously been weak for the last month or so, but over the last two weeks have shown some stabilization above the 200-DMA, including two different days when the price dropped below the 200-DMA intraday but bounced. If the 200-DMA holds in the near-term, gas prices are likely to stop declining, so this will be a key level to watch for what will ultimately determine the health of the consumer. Click here to learn more about Bespoke’s premium stock market research service.
Jun 30, 2022
As we noted in today’s Chart of the Day, inflation data has been moderating and so too have gas prices as demand has pulled back and refinery output rises as we discussed in last night’s Closer. Roughly two weeks ago, AAA’s national average price for a gallon of regular gasoline peaked just above $5. Granted it is still elevated, but that price has fallen to $4.86 today. Taking one step further up the supply chain, Gasoline futures peaked even further ago on June 9th and have fallen 14.5% since then. As shown in the second chart below, that decline is now putting the past several month’s uptrend on the ropes.

While both the national average and gasoline futures have been rolling over, the decline in the latter has been far larger as those prices tend to slightly lead retail prices. As for the size of that disconnect, taking the spread of the one-month percent change of the two measures of gasoline is historically wide at 14.4 percentage points. The last times such a divergence has been observed were earlier this spring, last fall, and back in 2020. In those periods, such divergences were short-lived. As shown in the bottom chart where we overall the AAA national average and Front Month Gasoline futures, moves in the futures market tend to lead prices at the pump, in other words, it is unlikely retail prices will continue to fly in the face of lower futures prices. Click here to learn more about Bespoke’s premium stock market research service.


Jun 1, 2022
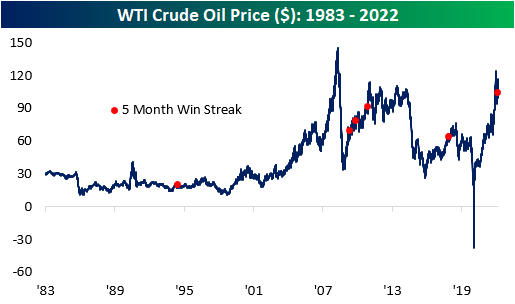
Coming out of Memorial Day weekend, WTI crude oil closed out May with its sixth straight monthly gain, resulting in the second-longest streak going back to 1983. Everyone with a car has dealt with rising costs at the pump, and the AAA national average price per gallon is currently $4.67, the highest level on record. This comes as the Biden administration has halted the importation of Russian oil, and the European Union attempts to reduce its energy dependence on Russia as well. At the same time, the reopening has caused a pick-up in demand, and the gross imbalance of supply and demand has pushed up prices to nearly unprecedented levels.

Since the US government stopped price controls on US crude oil in the early 1980s, there have only been six other periods where WTI prices rose for five or more consecutive months. As you can see from the chart below, half of these occurrences were shortly after the Global Financial Crisis, as prices rebounded from the sharp downturn in prices during the financial collapse, and the most recent was in early 2018.
Following five consecutive months of gains in oil, the average performance has been relatively weak compared to historical averages. In the first five months of each streak, oil prices have rallied by an average of 40.9% (median: 38.6%), which is nearly ten times higher than the average of all five-month periods since 1983. However, oil tends to underperform in the near term following these occurrences, registering an average loss of 3.2% and 0.8% over the next week and month, respectively. Notably, this was the only occurrence in which the price of oil climbed higher in both the following week and month, gaining 4.9% and 9.5% respectively. The only period in which the average performance was higher than that of all periods is three months, as oil has averaged a gain of 4.4% after a streak of five months is reached.

The chart below summarizes the performance one year before and after a streak of five months is reached. As you can see, oil has traded most similarly to the late 2009 occurrence, in which the price of oil rose by 15.1% in the following year. Long story short, although the average performance in these time periods is relatively weak, there isn’t a clear trend in performance in one direction or the other. Click here to become a Bespoke premium member today!
