May 5, 2022
In last night’s Closer, we recapped the market reaction to the FOMC’s 50 bps rate hike noting that equities really took off once Fed Chair Powell ruled out the possibility of 75 bps hikes on the horizon. By the close, the S&P 500 rallied 2.55% from right before the decision (1:59 PM). As shown below, that marked the third-best S&P 500 reaction to a Fed day since 1994 when the FOMC began to announce its decision on the same day as the meeting.

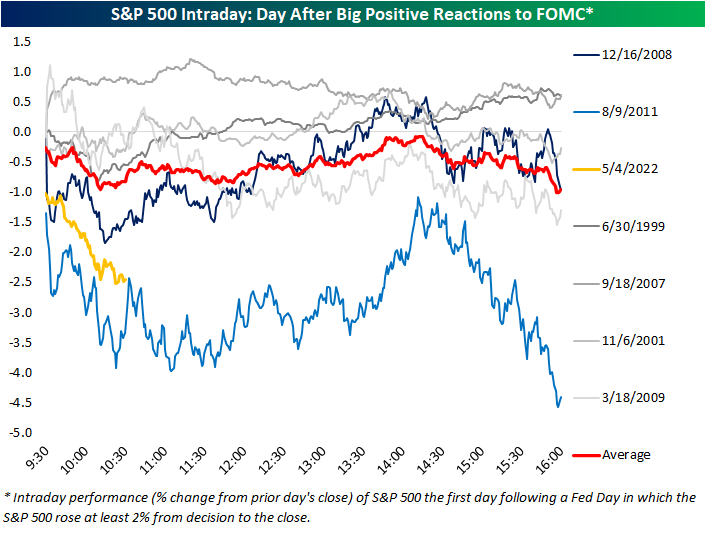
Given today’s massive declines, the S&P has already erased its 2%+ post-FOMC gain. Below we show the S&P’s intraday performance the day after each Fed day when the index rallied over 2% post-meeting (1:59 to the close). For each day, the date shown represents the day of the FOMC meeting. On average, the S&P 500 has tended to gap down the following day and continue to trade lower throughout the first post-FOMC session as we are seeing today.
Today’s performance is certainly on the weaker end of these occurrences, though. In fact, like the other two largest post-FOMC rallies that saw over 3% gains in the afternoon of Fed days, December 2008 and August 2011, today saw a significant gap lower with continued losses through mid-morning. The continued selling today is setting up to more closely resemble the August 2011 occurrence. Following the December 2008 instance, on the other hand, the S&P 500 found a low in the late morning and even briefly went positive the day after the big post-FOMC gain.
While today is shaping up to look like another time the market rallied hard in response to the FOMC, taking a step back to look at all Fed day afternoon performance (1:59 to the close) versus next-day performance (full day), there is not much of a strong trend. As shown below, the S&P 500’s performance from 1:59 to the close on a Fed day is a statistically poor explainer of next-day performance. That being said, today does stand out as one of the worst Fed day follow-ups on record. Click here to learn more about Bespoke’s premium stock market research service.

May 3, 2022
The S&P 500 (SPY) is down nearly 4% since the last FOMC meeting on March 16th when the Fed lifted off of the “zero bound” by hiking rates 25 basis points. As we approach the second rate hike of this cycle tomorrow, below is a snapshot of recent asset class performance using our key ETF matrix. For each ETF, we show its total return since the close on the date of the last FOMC meeting (3/16) as well as its total return since February 19th, 2020, which was the stock market’s closing high prior to the start of the COVID pandemic.
Starting with performance since the Fed hiked rates for the first time back in March, we’ve seen across-the-board declines in US equities with the exception of a few sectors. Small-caps and the Nasdaq have been hit hardest since the March rate hike, while the Dividend ETF (DVY) has managed to post a small gain. Communication Services and Financials have been the hardest hit sectors with declines of 8%+, while Energy and Consumer Staples are both up more than 5%. Outside of the US, not one country ETF is up since the Fed hiked rates, and Germany and China are both down ~10%. The China ETF (ASHR) is down more than any ETF in our matrix since the first rate hike, but the 20+ Year Treasury ETF is right on its heels with a decline of 10.1%. Even gold and silver are now down since 3/16, while energy and agricultural commodities are in the green.
As asset prices have fallen in 2022, we’ve seen quite a few areas of financial markets really start to give up post-COVID gains. The S&P 500 has still posted a total return of nearly 28% since pre-COVID, but the small-cap Russell 2,000 is up less than 15% at this point. Looking at US sectors, Energy is up the most since 2/19/20 with a gain of 61%. Materials and Technology are still up 40%+, while Industrials and Financials are up just 18%. Two sectors — Utilities and Communication Services — have posted total returns of less than 10% since the pre-COVID high.
Outside of the US, India and Canada are both solidly green since the pandemic began, but countries like Brazil, Germany, Hong Kong, Italy, and Spain are all in the red. Commodity ETFs have been some of the best since the pandemic, although USO (oil) specifically is actually down 14% since the close on 2/19/20.
Treasury ETFs are down on a total return basis since pre-COVID, with TLT down the most at 15%. The only bond ETF that has offered some protection post-COVID is the inflation-protected TIP, which is up 8.42%. Click here to learn more about Bespoke’s premium financial markets research.

Apr 6, 2022
See what’s driving market performance around the world in today’s Morning Lineup. Bespoke’s Morning Lineup is the best way to start your trading day. Read it now by starting a two-week trial to Bespoke Premium. CLICK HERE to learn more and start your trial.
“Bond investors are the vampires of the investment world. They love decay, recession – anything that leads to low inflation and the protection of the real value of their loans.” – Bill Gross
It’s looking like it’s going to be one of those days. Futures were just modestly negative overnight but then started to really weaken as Europe opened for trading and things haven’t stabilized since. The S&P 500 faces losses of around 1% at the open with the Nasdaq down over 1.5%. If equities were looking to rally coming into the week, yesterday’s Fed commentary put at least a temporary stop to that. Interest rates are higher across the curve and the 2s10s yield curve has steepened well out of inverted territory, but that comes along with yields on the 10-year above 2.6% to its highest level in just over three years.
The economic calendar is light today as weekly mortgage applications were the only release, and they fell 6.3% following a 6.8% last week and an 8.1% decline the week before that. Besides that, Energy inventories will be released at 10:30 and the Minutes from March’s FOMC meeting will be released at 2 PM. Philly Fed President Harker and Richmond Fed President Barkin will also be speaking this morning.
Read today’s Morning Lineup for a recap of all the major market news and events from around the world, including the latest US and international COVID trends.
For bond investors, these days are tough indeed. With inflation rampant around the world and central banks finally putting the brakes on the gravy train of liquidity, the increase in interest rates has been relentless with bond prices seeing some of their largest declines in years. A case in point is the iShares 20+ Year US Treasury Bond ETF (TLT). It’s already down 13% YTD and indicated to open lower today by another 1%. The chart below shows historical drawdowns from record closing highs in TLT since its inception in late 2002. Based on where the ETF is trading this morning, it has now declined 26% from its last record closing high back in early August 2020. Throughout its history, there have only been a handful of other periods where TLT ever experienced a peak to trough decline of more than 20%, and the only other time it dropped more was coming out of the Financial Crisis.

Start a two-week trial to Bespoke Premium to read today’s full Morning Lineup.