Jun 29, 2022
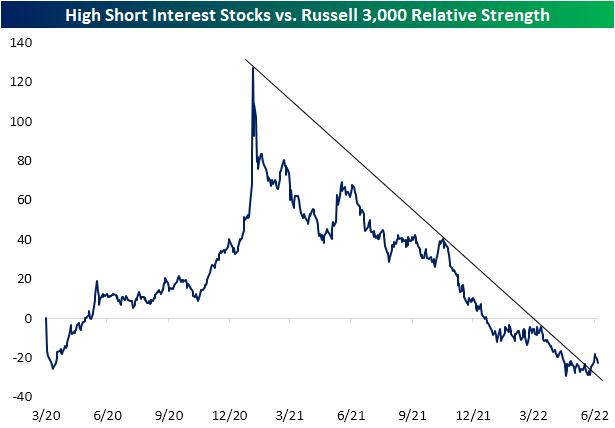
As we highlighted in a post yesterday, the relative strength of the 100 stocks with the highest levels of short interest against the Russell 3000 has broken its downtrend. This downtrend had been in place since the end of the meme stock mania in January of 2021. Just to refresh your memory, that chart is provided below.
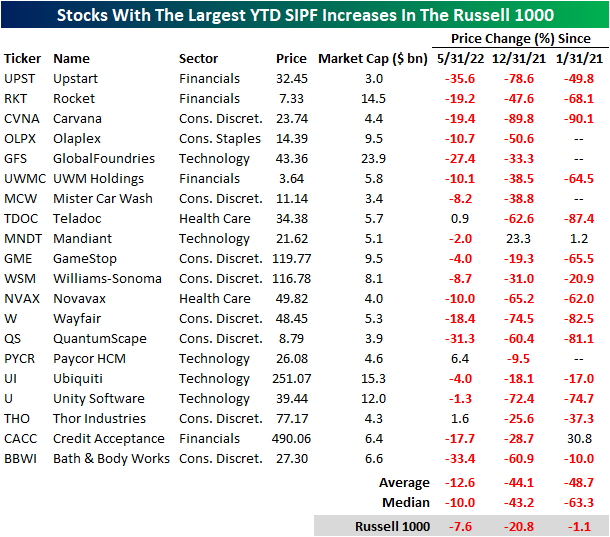
Today, we took a look at the 20 Russell 1000 stocks that have seen the largest increases in short interest as a percentage of float (SIPF) on a year to date basis. Leading this group is Upstart (UPST), the buy now pay later firm that has been decimated as growth stocks have gotten crushed and consumer confidence weakens to historic levels. UPST saw SIPF rise by 27.1 percentage points on a YTD basis and by an additional 2.0 percentage points in June. Notably, UPST appeared on our Top 20 P/S Decliners list as well, which we published yesterday. Unity Software (U) is the only other name to appear on both lists. The largest names on this list by market cap are GlobalFoundries (GFS), Ubiquiti (UI) and Rocket (RKT).

The performance of these twenty names has been quite weak on a month over month and YTD basis. Additionally, these names have massively underperformed the broader index since the end of the meme stock mania, trading down by 48.7% on average (median: -63.3%) compared to the Russell 1000’s loss of just 1.1%. On a YTD basis, these stocks have shed 44.1% of their value on average, which was accelerated by a 12.6% average loss since the end of May. Although it’s difficult to find any positivity in these names, they are primed for short squeezes or reversals as shorts cover their positions (which forces buying. Click here to learn more about Bespoke’s premium stock market research service.
Jun 15, 2022
As mentioned in our piece from earlier today, gold did not necessarily deliver superior performance during the last QT cycle. This leaves investors to ponder: which asset classes did deliver substantial returns? Is there anywhere to hide? Although the macroenvironment is vastly different this time around, it is still helpful to look at past occurrences to attempt to put a frame of reference around today’s markets. Major differences include rampant inflation (particularly in commodities), supply chain constraints, lapping stimulus benefits, and weakening economic data. Below, we summarize the performance of the S&P 500, bonds, agricultural commodities, and oil during previous QT cycles.
The S&P 500 outperformed Gold during the last QT cycle, gaining 19.2%, which constitutes an annualized return of 10.1%. The graph below outlines the performance of the S&P 500 ETF (SPY) during different cycles of QE and QT. As you can see, equities were not particularly steady during the last QT cycle, but SPY gained significantly after the Fed announced its intent to slow the balance sheet winddown.

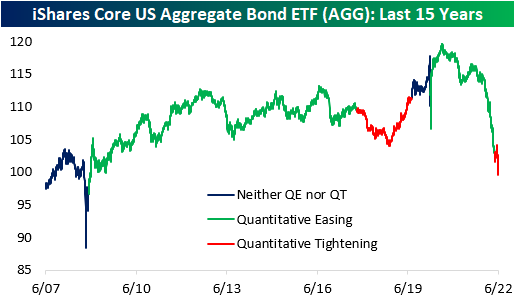
In the last QT cycle, the bond market initially sold off but managed to finish higher for the entire period. The iShares Core US Aggregate Bond ETF (AGG) bottomed at a drawdown of 4.7% about a year after the cycle began but proceeded to gain 6.7% through the final 203 trading days of the cycle. When all was said and done, AGG finished the cycle with gains of 1.7%. Similar to what we saw in gold, much of the gains were seen after the Fed announced its plan to slow the wind-down of the balance sheet. This suggests that rates rose at first but then reversed course when the Fed announced the impending end of QT. So far in the current cycle, AGG has already dropped by 2.7%, but bonds sold off hard in anticipation of QT in late 2021 and early 2022. On a YTD basis, the ETF is down a whopping 12.7%.
Agricultural commodities performed poorly during the last QT cycle, dropping 15.7%. This constitutes an annualized return of -8.9%, but the broader agricultural space was in a downtrend before QT began. Currently, agricultural commodities are in an uptrend, so it will be interesting to watch the price action as QT ramps up. On a YTD basis, the Invesco DB Agriculture Fund (DBA) is up 10.2% and is essentially flat since QT began in early May.

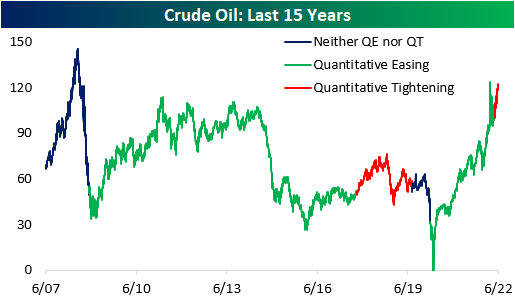
During the last QT cycle, crude oil gained 15.8%, but it would be difficult to attribute these gains to quantitative tightening. Since the Fed began tightening this year, crude oil has jumped 16.0% higher. In the last cycle, oil rallied higher before subsequently crashing, which would certainly be welcomed by many in this cycle. Click here to become a Bespoke premium member today!
Jun 14, 2022
See what’s driving market performance around the world in today’s Morning Lineup. Bespoke’s Morning Lineup is the best way to start your trading day. Read it now by starting a two-week trial to Bespoke Premium. CLICK HERE to learn more and start your trial.
“He says we’re going the wrong way.”
“Oh, he’s drunk. How would he know where we’re going.” – Planes, Trains & Automobiles

Below is a snippet of content from today’s Morning Lineup for Bespoke Premium members. Start a two-week trial to Bespoke Premium now to access the full report.
After four days of basically getting their faces beat inside out, bulls are trying to make a comeback this morning aided in part by a PPI report that wasn’t stronger than expected. Small business sentiment also managed to come in slightly better than expected, although it remains weak. One item covered in today’s Morning Lineup commentary is the fact that inflation expectations in the latest ZEW survey didn’t show a pickup in inflation expectations for the US or Eurozone.
In today’s Morning Lineup, there’s a lot covered as we discuss trading in APAC and European markets (pg 4), whether or not the Fed will go 50 or 75 bps tomorrow (pg 5), overnight economic data in Asia and Europe (pg 6), and much more.
Over the last two years or so, the market has come full circle. In February and March of 2020, there was that five-week period where the only direction the market would move was lower. Shortly after, the Federal Government and Federal Reserve unleashed massive amounts of stimulus, and the market started to turn around. By early 2021, the market had completed a complete 180, and the only direction it could move was higher. Then, late last year as government stimulus started to dry up and the Federal Reserve started to get religion on inflation, cracks in the market started to emerge. By early this year, we were calling it a one-step forward and two-step backward market where every positive day was offset by at least two bad days taking the market to progressively lower levels in the process.
As painful as the one-step forward and two-step backward market felt, at least there were some positive days. Over the last few days, it has become a one-directional market, and the direction has been extreme in the wrong way. Over the last four trading days, the net advance/decline (A/D) reading for the S&P 500 has been negative 400 or lower meaning that in each of the last four trading days there have been 400 more stocks that traded lower on the day than higher. To give you some perspective on how extreme this type of streak is, since 1990, there have been ten years where for the entire 12 months there weren’t even four days where the net A/D reading for the S&P 500 was at negative 400 or lower. As shown in the chart below, there has never been a streak of similar duration, and the only time there were even three consecutive days of -400 readings was in August 2015 at the height of concerns over the Chinese yuan devaluation.

Start a two-week trial to Bespoke Premium to read today’s full Morning Lineup.
Apr 25, 2022
It was another weaker than expected regional manufacturing report this morning as the Dallas Fed’s survey came in at 1.8. The index was expected to decline, but to a more modest reading of 3.5 from last month’s level of 8.7. With expectations declining hand in hand, this report indicates southern manufacturers have seen a significant deceleration in growth and also expect that to continue in the future as the indices for current and future conditions are around the weakest of the pandemic.

Current condition indices out of Dallas more closely resembled the results of the Philly Fed survey last week with weak breadth and readings falling into the middle of their historical ranges. However, like both the Philly and Empire Fed readings, expectations are deteriorating much more quickly than current conditions. As shown below, while many current condition indices are at worst in the middle of their historic ranges, some expectations indices have fallen into the bottom decile of readings after historically large declines month over month in April. For example, the decline in expectations for New Orders ranks in the bottom 1% of all month-over-month moves.
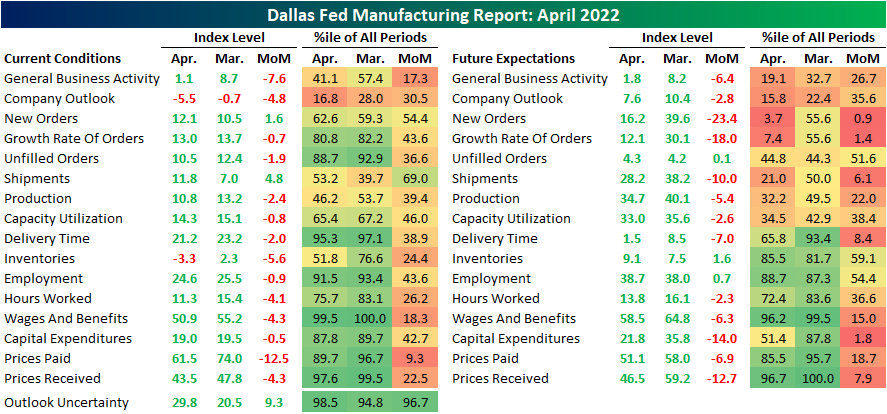
Two indices for current conditions were in contraction in April. The first was inventories while the other, and more negative, was company outlook. This index is now at its lowest level since the historic lows set in the spring of 2020. While still positive, the same can be said for expectations as they have breached new lows as well. That means on net more reporting firms are seeing economic conditions deteriorating than improving.

At the moment, demand has held up with the index for New Orders ticking up slightly though it is well below levels set earlier in the pandemic. As such, Unfilled Orders are still growing but at a slower rate as Shipments saw a modest increase off of post-pandemic lows. Again, in spite of any improvements reported in current conditions, Texas manufacturers do not expect much good to come on the horizon. The monthly declines in expectations for New Orders and New Order Growth Rate rank in the bottom 1% and 2%, respectively, of all monthly changes. While it was not as large of a drop, shipments similarly experienced a sharp decline ranking in the bottom few percentiles.

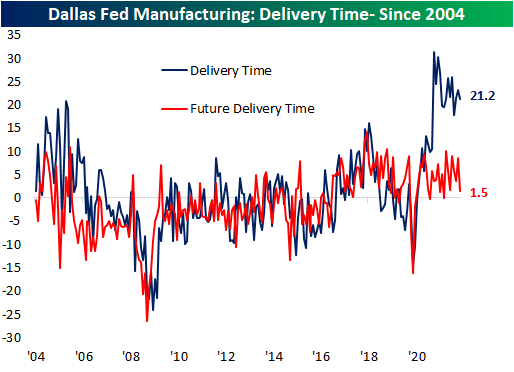
As for one silver lining of the report, there was further evidence of easing of supply chain stress with the Delivery Time index falling to 21.2. This index has been consistently falling over the past year. Expectations saw a coincident decline.
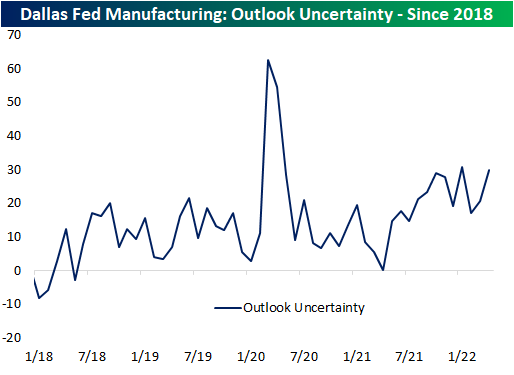
The Dallas Fed also includes in the report an index on uncertainty; a newer index only dating back to 2018 tracking the change versus the prior month in the firm’s uncertainty about company outlook. This index has returned to the upper end of its range near 30. That is slightly below the January reading for the highest levels in the series’ history outside of the beginning of the pandemic.
Be sure to check out tonight’s Closer which will provide an update of our Five Fed Manufacturing Composite, which combines these Dallas Fed readings with those of the Empire and Philly Fed surveys to gauge overall national manufacturer activity. Click here to view Bespoke’s premium membership options.
Apr 21, 2022
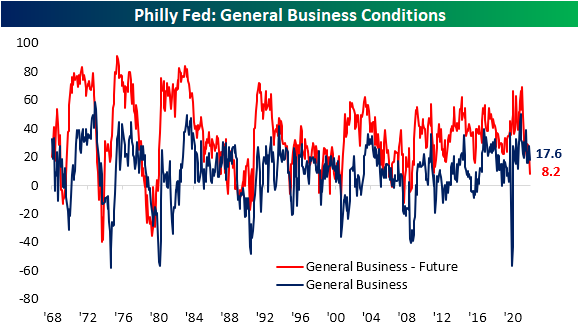
Today’s release of the Philadelphia Fed’s Business Outlook survey essentially saw the opposite results of last Friday’s Empire Fed release. Whereas the New York Fed’s headline number surged, the Philly Fed reading dropped from 27.4 to 17.6, well below expectations of 21.4.
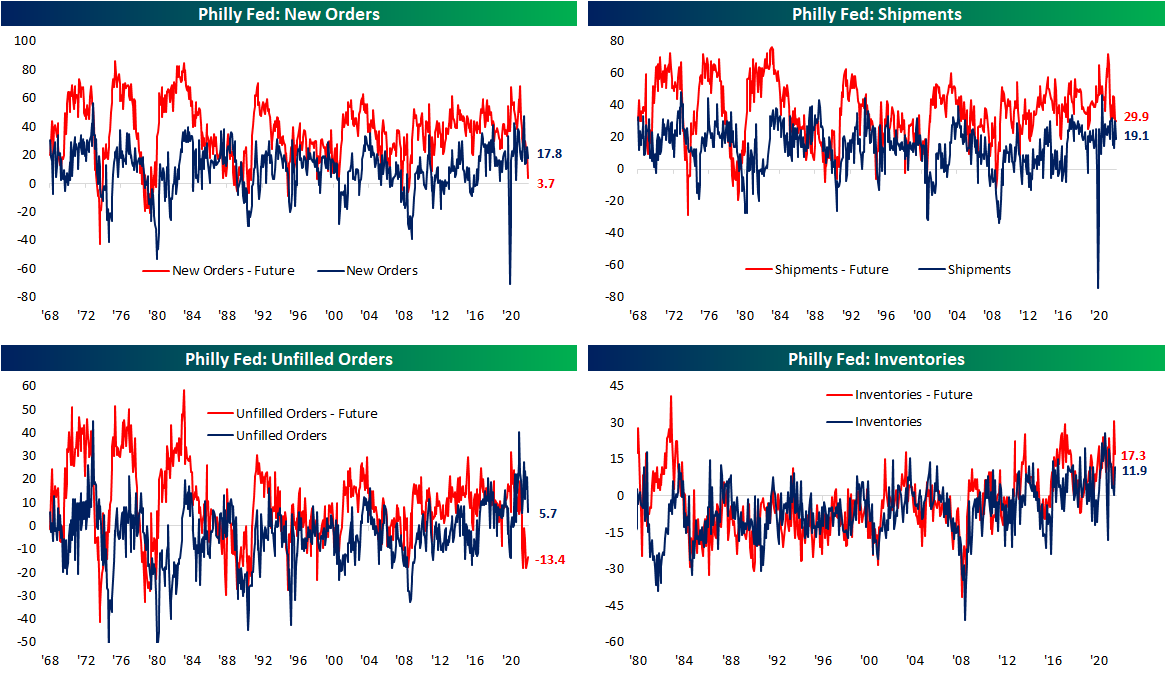
Even though current conditions indices of the two regional Fed surveys released so far this month mirrored one another, both were on the same page for future expectations. Like the Empire Fed, the Philly Fed saw broad declines across expectations indices. In fact, the only index that rose month over month was Unfilled Orders.

The April report showed a notable slowing of demand as New Orders fell 8 points, and that was the best of any demand-related index. Shipments and Unfilled Orders both dropped double digits. While still indicative of growth, just at a slower rate, these indices have fallen from upper quintile readings down to the 60th percentile range. Expectations indices are far more depressed. New Orders and Unfilled Orders are only in the 5th and 6th percentiles of their historical ranges, respectively. Ironically, Unfilled Orders was also the only expectations index to move higher in April. Inventories remain more elevated for both indices for current and future conditions. The former rose back into the upper decile of its range as the latter moderated from a 99th percentile reading last month.
As we noted earlier this week, one hopeful sign for supply chains from the Empire Fed survey was a dramatic improvement in Delivery Times. That was echoed in today’s release. The index sat just off record highs last month but after its third-largest month over month decline on record, the index has fallen all the way back down to 17.9 which is the lowest level since last February. Responding firms also report that they expect delivery times to decline in the future meaning more improvements in supply chains are expected.

Even though supply chains might not be as constrained, that does not mean firms are not paying less. The index for Prices Paid hit a new high for the pandemic with the index rising to 84.6. That is now the highest reading since June 1979. As for how those increases are being passed to consumers, Prices Paid remain off the peak from this past November with only a slightly higher reading month over month in April.

While Prices Paid came close, it was not able to set a record high this month. The index for Number of Employees however did. Moving higher for the third month in a row, this index hit a new record high of 41.4. That means Philly area manufacturers are taking on the highest number of new workers since the beginning of this survey in 1968! The average workweek remains historically elevated and off of recent lows, but that is also well below the highs earlier in the pandemic. Expectations however saw the first negative reading since February 2016. In other words, with a larger number of new hires coming on board, the average workweek is expected to shorten in the near future. Click here to view Bespoke’s premium membership options.
