Jun 29, 2022
There’s no questioning that markets have been extremely volatile this year. Yesterday, the Nasdaq 100 tracking ETF (QQQ) declined by 3.0%, which for 2022, has not been a foreign occurrence. In fact, yesterday was the eleventh time this year that QQQ fell by at least 3%. Since QQQ began trading in 1999, this will be the fifth-highest number of 3%+ daily declines in the first half of the calendar year (top chart below). Although the number of 3%+ daily declines is still well below 2020 and dot-com era levels, it is still a significantly elevated reading. In fact, this year’s first-half pace has been well ahead of levels from 2008 and 2009 and is only three shy of the pace in 2020. Click here to learn more about Bespoke’s premium stock market research service.
Volatility has not been exclusively to the downside, though. On top of the 11 3%+ declines, there have been nine days so far in 2022 in which QQQ rose by at least 3%, bringing the total number of absolute daily moves of 3%+ to 20. This too ranks fifth of all years since 1999, falling five short of 2020 and 31 short of 2000.

Of all 260 3%+ daily declines in QQQ since 1999, 143 occurred between the start of 2000 and the end of 2002 (the unwinding of the dot-com bubble). During this time, QQQ fell a whopping 74.3%! The chart below shows QQQ since 1999, with the red dots marking each 3%+ decline.

QQQ’s performance following these occurrences is heavily skewed by the dot-com era weakness. While performance over the following week has been slightly better than average versus all periods since 1999, forward returns in the following one and three months have trailed the long-term averages. Since the end of the dot-com bubble burst (2003), forward returns following these occurrences looks much more attractive with QQQ averaging a gain of 44 bps (median: 54 bps) in the week following a decline of 3%+. Over the following month, QQQ has averaged a gain of 1.4% (median: 1.6%) and over the next three months has averaged a gain of 7.3% (median: 7.2%). The positivity rates over the following week, month, and three months have been 57.6%, 58.3%, and 74.5%, respectively. Click here to learn more about Bespoke’s premium stock market research service.

Jun 7, 2022
The broader retail space has been weak relative to the S&P 500 so far this year. Much of this weakness came after Target’s (TGT) and Walmart’s (WMT) earnings calls, in which management noted margin compression, inventory gluts in certain categories, shifting consumer preferences, and weakness in consumer spending as inflation in food and energy reduces discretionary budgets. Institutional subscribers can view our Conference Call Recaps on these two companies by clicking here. On a YTD basis, the VanEck Retail ETF (RTH) has underperformed the S&P 500 (SPY) by 4.5 percentage points, trading down by 18.2% as of today. A chart of the relative strength of RTH vs SPY over the last year is shown below.

Within the S&P 500, there are 21 stocks that make up the Retailing industry, and in the table below, we have outlined the performance of the 10 largest stocks by market cap. You’ll notice that companies like Costco (COST) and WMT aren’t listed, but that’s because they are actually part of the Food and Staples Retailing industry. As you can see, seven of these ten stocks are down more than the average S&P 500 member on a YTD basis, and six are further from their respective 52-week highs than the average S&P 500 member. However, only two of these stocks are below their pre-COVID highs, whereas more than a third of (35.8%) of S&P 500 components are below their pre-COVID highs.

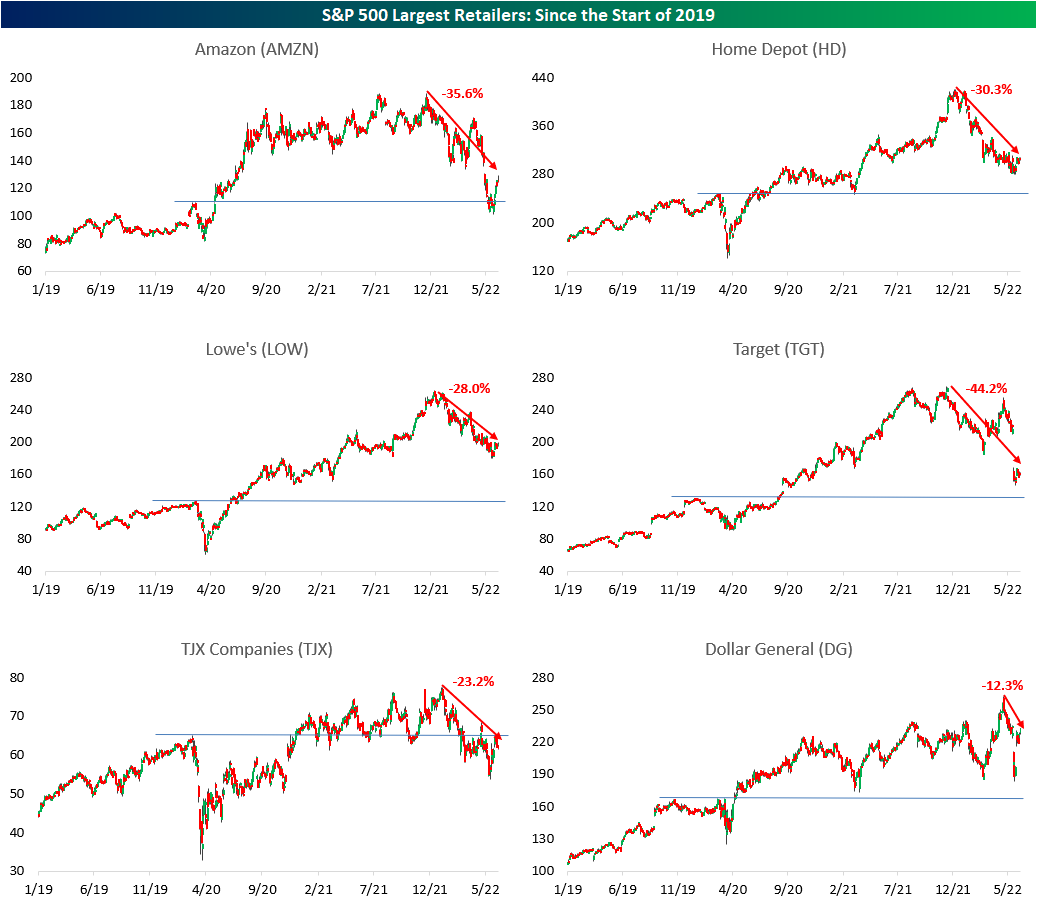
Below are charts of each of the 10 stocks listed above since the start of 2019. Included on each chart is the percentage that each is off its 52-week high. As you can see, AutoZone (AZO), Dollar Tree (DLTR) and Dollar General (DG) have held up relatively well amidst broader market weakness, likely due to their positioning on the value chain. The market seems to believe that consumers will move down the value chain amidst rising inflation, which makes our latest Little Known Stocks Report even more compelling. Click here to become a Bespoke premium member today!

Apr 22, 2022
This week’s Bespoke Report newsletter is now available for members.
Early Thursday morning, investors were feeling pretty good about the trading week. At that point, the S&P 500 was up 1% on the day and about 2.7% week-to-date, and the index had actually just pushed back above its 200-day moving average.
There was nothing we could identify in the news that caused the S&P to peak around 10 AM ET, but from that point through the closing bell on Friday, the index fell 5.3% in basically as straight of a line lower that you can draw.

Fed Chair Powell did, however, make comments in a speech at the IMF mid-day Thursday where he confirmed that a 50 basis point hike was “on the table” for the May meeting. Markets have been pricing high odds for 50 bps hikes for some time now, but Powell’s comments basically cemented them (for now).
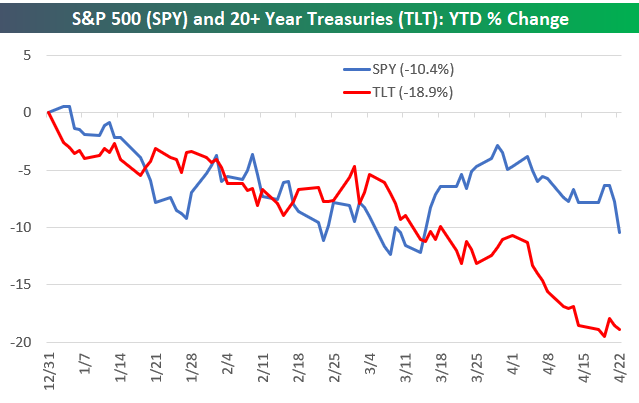
The Powell Fed is known for its jawboning and transparency when it comes to the path for rates. The chart below of equities and fixed income in 2022 tells you what these two asset classes currently think of that jawboning:
The snippet above is pulled from a page from this week’s Bespoke Report newsletter. If you’re not a Bespoke subscriber and you want to read this week’s full Bespoke Report (and access everything else Bespoke’s research platform has to offer), start a two-week trial to one of our three membership levels.


Apr 19, 2022
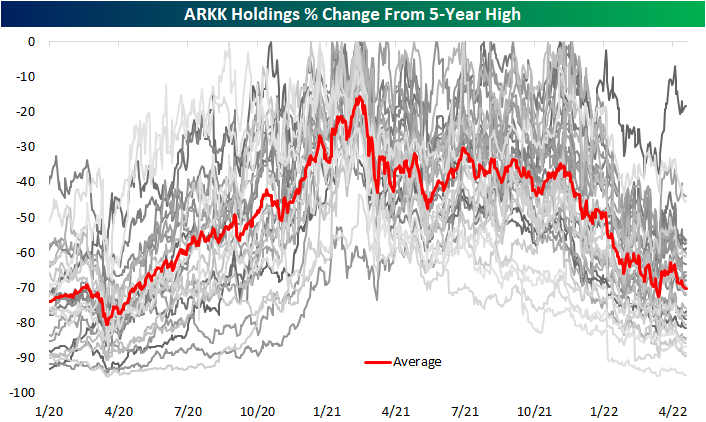
While it is seeing a large bounce today currently up 5% as of this writing, Cathie Wood’s flagship fund, the ARK Innovation ETF (ARK), has had a rough go of it over the past year and change. The ETF peaked in February of last year and has fallen over 60% in the months since then, erasing the entirety of the post-pandemic rally. As for the current holdings making up the ETF, everything has pulled back from post-pandemic highs which were mostly set either in early 2021 or late 2021. To highlight this, in the chart below we show each current holding’s change (in percentage terms) from its respective 5-year high. The average holding is currently down over 70% from its high. (ARKK holdings are released daily at ARK’s website.)
Below is a snapshot of current ARKK holdings and where they’re trading relative to 5-year highs. Year to date, only one stock in the ARKK ETF, Signify Health (SGFY), has managed a positive move as the average YTD decline currently stands at 40.8%. That being said, SGFY is still down over 60% versus its February 2021 high. As previously mentioned, most other holdings similarly peaked in the first quarter of last year while many others peaked more recently last fall. As shown in the table, the average peak date for all ARKK holdings was 3/11/21.
One of the stocks that hit a high last fall is the mega-cap EV giant Tesla (TSLA). Since its November 4th, 2021 high, TSLA has fallen only 18.41%, and it is only down 5% year to date. Even though hardly anyone would wish to see an investment lose nearly a fifth of its value, that is a substantially better result than most other ARKK holdings. For example, Berkley Lights (BLI) down 94% from its 5-year high, while 43% of the ETF’s holdings have fallen by at least 75%. Given that TSLA is by far the largest ARKK holding with a 10.55% weight, its smaller decline relative to the rest of the ETF’s holdings has helped ARKK from falling even more.
With the average ARKK stock down 70% from its 5-year high, it’s going to take a huge rally in the “growth” space to get back to prior levels. As shown at the bottom of the table, the average stock in the ETF now needs to rally 348% to get back to prior highs! Click here to learn more about Bespoke’s premium stock market research service.

Bespoke Investment Group, LLC believes all information contained in this report to be accurate, but we do not guarantee its accuracy. None of the information in this report or any opinions expressed constitutes a solicitation of the purchase or sale of any securities or commodities. This is not personalized advice. Investors should do their own research and/or work with an investment professional when making portfolio decisions. As always, past performance of any investment is not a guarantee of future results. Bespoke representatives or clients may have positions in securities discussed or mentioned in its published content.
Apr 12, 2022
Sentiment on the part of small businesses deteriorated further in the month of March as the NFIB’s Small Business Optimism Index dropped 2.5 points to 93.2. That took out the January 2021 level for the weakest print for the index since the start of the pandemic in the spring of 2020.

Considering the headline index is only a couple of points above the pandemic low, last month’s reading is only in the 16th percentile of all months on record going back to the start of the report in 1986. The month-over-month decline was also historically large ranking in the bottom decile of all monthly changes. The same could be said for multiple other categories. For example, expectations for the economy to improve and expectations for higher real sales came in at or close to record lows as the month-over-month declines were in the bottom 2% of all monthly moves. This downbeat sentiment was a complete disconnect from the levels of actual sales changes (more on this below). On the other hand, there is a wide variation across categories with top decile readings for several indices like plans to increase employment, current inventories, job openings hard to fill, and compensation-related indices.

Many of the strongest readings of the report are related to employment. Plans to increase employment have pulled back significantly from pandemic highs and are back within the range of readings from the few years prior to the pandemic. Regardless, March’s reading was in the top decile of historical readings. Actual reported changes to employment, however, have continued to fluctuate around zero and were negative in March meaning small businesses saw a decrease in hiring. That lack of hiring comes as businesses continue to report historic difficulty in filling open roles. This reading too has been rolling over though. That is echoed by fewer businesses reporting the cost or quality of labor as their single biggest concern. That combined reading has fallen from a high of 40% in September of last year to only 30% today. As other issues (namely inflation) have taken precedent as the main concern of small business owners, cost of labor remains elevated with near-record but peaked readings in compensation and compensation plans.

As employment metrics remain elevated but show signs of rolling over, readings on expectations for general conditions and sales remain weaker. Outlook for general business conditions stands out as the weakest reading of the report as the index dropped another 14 points in March to set the bar even lower for a record low. Given the pessimism surrounding business conditions, the share of businesses reporting now as a good time to expand fell for the third month in a row to match the February 2021 low. One likely reason for the aforementioned pessimism is soaring prices shown through yet another record high set by the higher prices index.
Not only has the outlook for general business conditions soured, but so too have sales expectations. Small businesses reported the worst expectations for sales since the spring of 2020. The only other period in the history of the data going back to 1986 with as weak of an optimism reading for sales was during the Great Recession. That stands in stark contrast with the actual reported sales changes. Small businesses actually reported positive momentum for sales, though, higher costs are likely eating into profitability as actual earnings changes went unchanged at deeply negative levels. In the release, the NFIB highlighted that of those respondents who reported lower profits, 35% blamed higher material costs and 13% reported higher labor costs. Another 23% blamed weaker sales. Click here to view Bespoke’s premium membership options.
