Aug 1, 2022
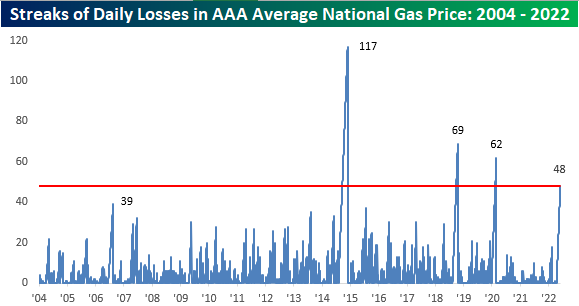
In 2022, extremely elevated gas prices have been impacting the economy, as every product-producing company has seen energy and transportation costs increase, forcing price hikes on the part of businesses simply to keep margins flat. Although there are a variety of factors affecting CPI readings, high gas prices certainly apply upward pressure. Today, gas prices are still extremely elevated compared to historical levels. At the AAA current national average of $4.22, just 1.8% of all days since the start of 2005 have seen a higher national average high, and all of them occurred this year. Click here to learn more about Bespoke’s premium stock market research service.

The national average price per barrel is still up 32.75% y/y, but this is actually the smallest y/y increase so far in 2022 and comes as the national average price has declined for 48 consecutive days. That’s the fourth longest streak on record. This streak is certainly notable, but gas prices are still at a level that is wearing on consumers.

The 40-day rate of change in average gas prices (-15%) has been notable as well, with only six other periods seeing a larger decline on a percentage basis. The most recent occurred during the COVID crash when it became clear that demand was going to deteriorate due to government-imposed mandates across the globe. Consumers will hope for further declines as we begin to near the $4.00 per gallon level. Not only have prices been falling lately, but they have also been more volatile than usual, as the current 50-day standard deviation (26 cents) is 3.2 times higher than the average since 2005. Click here to learn more about Bespoke’s premium stock market research service.

Jul 20, 2022
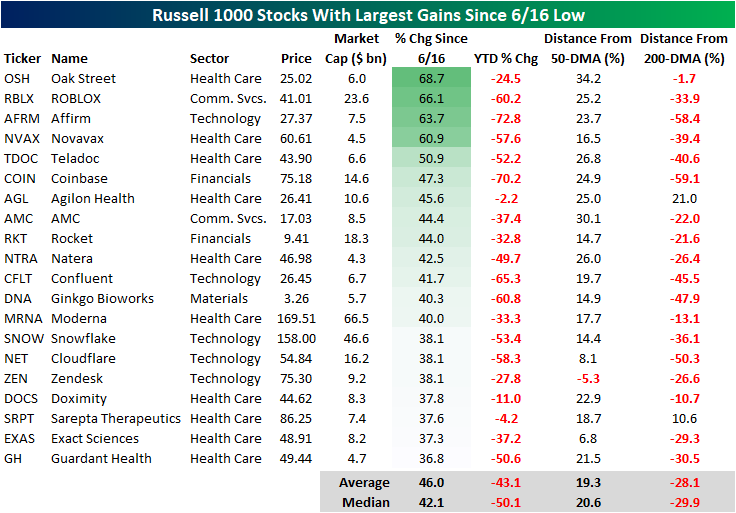
Since June 16th, the market has reversed course higher, making the date at least a near-term bottom. From a technical perspective, the Russell 1000 broke through its 50-day moving average yesterday and broke above its upper downtrend line today. The 50-DMA is still moving lower, but this is the first time that the Russell 1000 has been above the 50-DMA since April 20th. However, the index is still 9.7% below its 200-DMA. These moves come as commodity prices have pulled back and earnings season begins.

As we highlighted in a Chart of the Day earlier this week, the lagging sectors during bear market declines tend to be the leaders in bear market rallies, which is holding true in the bounce since 6/16. The table below shows the 20 best performing stocks in the Russell 1000 Index since the 6/16 low. As you can see, these stocks are all still down considerably on a YTD basis, declining a median of 50.1%. However, these stocks have rebounded by a median of 42.1% since the low on 6/16. Only one of these stocks is below its 50-DMA, and only two are above their respective 200-DMA. If you think that the bear market has concluded, these would be some of the names worth looking deeper into.
On the other hand, the best performing sectors during bear market declines tend to be the worst performing sectors during bear market rallies. Of the 20 worst performing Russell 1000 stocks since 6/16, 14 belong to the energy sector (which has been the best sector on a YTD basis by a wide margin). On a median basis, these 20 stocks are still up 13.6% on a YTD basis, but they’ve shed 13.7% of their value since the market bottomed in mid June. Notably, these stocks (on a median basis) are closer to their 200-DMAs than they are to their 50-DMAs. If you think that we are currently in a bear market rally that is bound to reverse course, these names would be worth looking deeper into.

Jul 6, 2022
Up until June 8th, the Energy sector was the only thing working in the market. However, the sector has reversed dramatically, falling close to 25% since. This comes as the price of oil pulls back and the White House targets the entire vertical with accusations of profiteering. As any investor knows, the price of oil is not set by individual energy companies, but rather by the forces of the market. Interestingly, the same administration that is pressuring oil companies to increase supply campaigned on the fact that they would not allow for drilling permits to be renewed on federal land, so the current rhetoric is… interesting to say the least. To quote Biden himself: “Number one, no more subsidies for the fossil fuel industry. No more drilling on federal lands. No more drilling, including offshore. No ability for the oil industry to continue to drill, period.” Rhetoric like this can logically cause a reduction in domestic energy investments, as CFO’s adjust capital expenditures based on added legislative risk.
Nonetheless, the price of oil has pulled back significantly, which causes a compression in gross margins for suppliers. Oil is currently trading at about $100 per barrel. Although oil is still up over 33% YoY, it has pulled back by 23.3% relative to highs. Most industries will breath a sigh of relief, but energy companies will be in the other camp. Notably, crude recently broke its uptrend, and seven of the last 15 trading days have seen declines of 3% or more.

Below is a chart showing the rolling % of 3%+ daily declines over all 15-day periods. As you can see, this is an extremely elevated reading, surpassed by just The Great Recession and the COVID Crash. Following the high reading in 2008, XLE rebounded 8.9% in the next week and 7.8% over the next month. In March of 2020, XLE fell by an additional 13.1% over the next week, but rebounded 14.7% over the following month after the peak reading.

Below are snapshots of S&P 500 Energy stocks as they currently stand versus where they stood on June 8th when XLE peaked. All but one of the stocks have entered an oversold range after every single one was overbought as of 6/8. What a difference a month can make! On average, these stocks were up 66% YTD (median: 64.8%) on June 8th, but are now up an average of just 22.3% on a YTD basis (median: 18.0%). Between the close on 6/8 and 7/5, the average stock on this list fell by 26.1% (median: -26.7%), delivering pain to investors who bought the rip. Click here to learn more about Bespoke’s premium stock market research service.


Jun 1, 2022
Each day in our Sector Snapshot, we provide an update on each sector’s weighting within the S&P 500. Given the astounding rally in Energy stocks, the sector has gone from a record low weighting of only 1.9% in November 2020 up to a high of 4.9% last week. That is back to levels seen in the summer of 2019, and it’s also a level consistent with what we saw in the late 1990s through the first few years of the 2000s. Of course, the larger a sector’s weighting, the more impact its moves have on the broader S&P 500.
Meanwhile, another traditionally cyclical group, the Industrials, has seen its weighting steadily decline. At only 7.76%, the current reading is only about 0.3 percentage points above the pandemic low in weight which also marked a record low going back to at least 1990. Historically, Industrials have had less dramatic fluctuations in weight than Energy, but it has seen a consistent grind lower over the decades, reflecting the broader shift in the US economy from predominately goods to service-based.

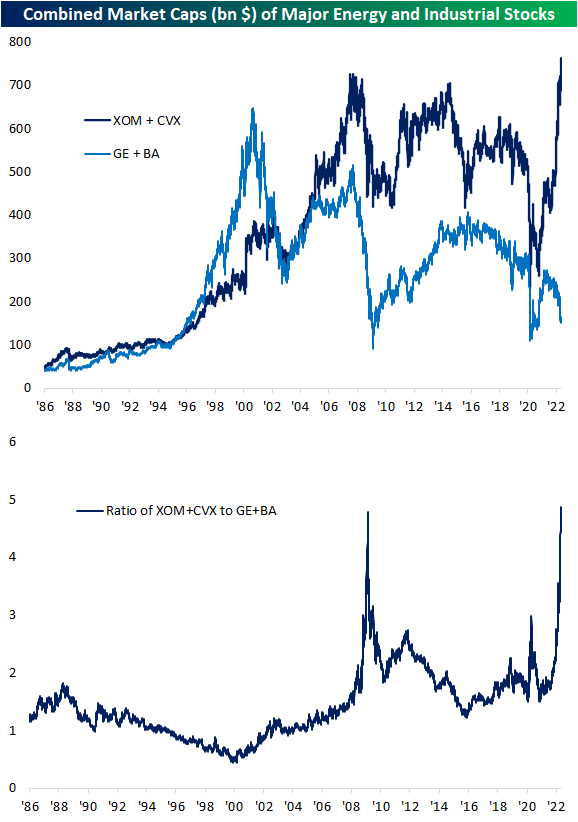
In an earlier post, we noted how two of the biggest stocks in the Energy sector by market cap, Exxon Mobil (XOM) and Chevron (CVX), have seen explosive and unprecedentedly large moves higher over the past couple of years. This is the first time these stocks have seen their market caps rise in any sort of a significant manner since the mid-2000s. As shown below, the two now account for nearly three-quarters of a trillion dollars in market cap, surpassing the previous peak in late 2007. That accounts for roughly 44% of the total size of the S&P 500 Energy sector as well.
Below we compare the combined market caps of XOM and CVX to what have historically been two of the most prominent stocks in the Industrials sector: Boeing (BA) and General Electric (GE). Right around 2000, these two stocks had a combined market cap of ~$650 billion. Over the two decades since then, these two stocks have fallen from grace with their current market caps now totaling just $163.9 billion! Relative to the market cap gains of Exxon Mobil and Chevron, the recent move has been nothing short of exponential as shown in the second chart below. The only comparable period was in 2009 when both groups fell, but the Industrial names were hit much harder.
As we discussed in regards to Tech stocks now versus the Dot Com Peak in March of 2000 in last week’s Bespoke Report (pages 20 & 21), the big declines in the size of GE and BA as XOM and CVX rocket higher are yet more examples of the ebb and flow of market leadership. Click here to learn more about Bespoke’s premium stock market research service.
May 24, 2022
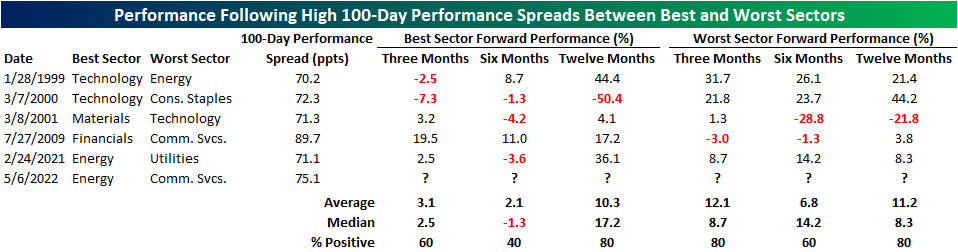
There’s no questioning that the equity market has been extremely volatile this year. So far in 2022, the S&P 500 has averaged an absolute daily move of 121 basis points (bps). Although the broader index has been incredibly weak over the last 100 trading days (down 17.1%), performance among individual sectors has diverged widely, as Energy has gained 50.7% while the Communication Services sector has declined 32.0%. The 82.7 percentage point performance spread between the two sectors is one of the highest on record. Only July of 2009 and March of 2000 saw higher readings.

Since 1990, there have only been six times in which the best-worst 100-day performance spread crossed above 70 ppts for the first time in at least 50 trading days. This tends to occur amidst a volatile market environment. In the late 90’s, investors flooded into technology stocks while dumping ‘traditional’ stocks, which led to the Technology sector outperforming Energy by 70.2 percentage points in a 100-trading day span ending on 1/28/1999. When the dot-com bubble began to burst, the inverse occurred, and Materials outperformed Technology by 71.3% in the 100 trading days ending 3/9/2001. Coming out of the Global Financial Crisis, the Financials sector roared off of a depressed base, leading to outperformance against the Communication Services sector of 89.7 ppts. In late February of 2021, the Energy sector began to bounce back after the demand shock in the industry began to abate, while the Utilities sector remained relatively weak, leading to a 100-day performance spread of 71.1 ppts. This year, the sky-rocketing price of oil has propelled energy stocks higher while the Communication Services sector has been hampered by concerns that a peak demand environment was reached in 2020 and 2021 while valuation multiples have simultaneously contracted (largely due to the Fed’s hawkish pivot) pushing the 100-trading day performance spread out to 82.7 ppts.

As investors, we must remain forward-looking. So, what typically happens after dramatic performance spreads are reached between the best and worst sectors? It’s a small sample size, but based on the previous five occurrences, investors should consider rotating out of the best performing sector (which in this case would be Energy) after the spread hits 70 percentage points and move into the worst performing sector (Communication Services).
Three months after these occurrences, the worst-performing sector over the prior 100 trading days has booked a median gain of 12.1%, which is nine ppts better than that of the best performing sector. Six months later, the median performance of the worst-performing sector in the initial 100 trading days outperformed the best performing sector by 15.5 ppts. Interestingly, twelve months later, the best performing sector in the initial 100 trading days regained the lead over the worst-performing sector outperforming on a median basis by a margin of 17.2% to 8.3%. In terms of consistency, three and six months later, the previously worst performing sector outperformed the best performing sector three out of five times, but a year later, the previously best performing sector outperformed the worst-performing sector four out of five times. Click here to become a Bespoke premium member today!