Jul 25, 2022
See what’s driving market performance around the world in today’s Morning Lineup. Bespoke’s Morning Lineup is the best way to start your trading day. Read it now by starting a two-week trial to Bespoke Premium. CLICK HERE to learn more and start your trial.
“It’s a recession when your neighbor loses his job; it’s a depression when you lose yours.” – Harry Truman

Below is a snippet of content from today’s Morning Lineup for Bespoke Premium members. Start a two-week trial to Bespoke Premium now to access the full report.
The weather has been hot across much of the country the last several days, and that heat will move to the markets this week with a busy schedule of economic data, peak earnings season, and the FOMC announcing its latest policy decision.
Ahead of the kickoff of trading, equity futures and bond yields are modestly higher along with crude oil and copper. On the downside, Bitcoin is down over 3% while gold is flat. Over in Europe, Germany’s ifo index tracking the business climate fell more than expected as a recession looks increasingly likely.
Today’s Morning Lineup discusses earnings news out of Europe and the Americas, economic data from around the world, and much more.
With all the earnings and economic data on the calendar this week, investors will likely have a much better read on the economy and its direction on Friday. Several indicators have already pointed to the increased likelihood of a recession, and the yield curve has also been indicating a more precarious economic picture. While the spread between the yields on the 10-year and 2-year US Treasuries has been negative for three weeks now, the spread between the 10-year and the 3-month yields has yet to move to inverted levels. A few months ago, the relative steepness of the Fed’s preferred yield curve measure was cited as a reason why a recession was not in the cards. However, after flattening by nearly 200 bps to just 40 bps in the last three months, even this part of the curve (light blue line) looks much less comforting.

Start a two-week trial to Bespoke Premium to read today’s full Morning Lineup.
Jul 6, 2022
Investors often turn to Gold as a safe asset in tumultuous times, as the asset tends to hold its value during market downturns. For example, when the S&P 500 sold off by 34.1% during the COVID Crash, the SPDR Gold Trust (GLD) declined just 3.6%. In 2022, GLD initially acted as a strong hedge to the equity market, gaining 1.0% on a YTD basis on June 16th as SPY entered bear market territory. However, GLD topped out in early March and is now trading 14.0% off of its closing 2022 high. GLD has even underperformed SPY since March 8th, declining 14.0% versus SPY’s drop of 8.2%. Click here to learn more about Bespoke’s premium stock market research service.
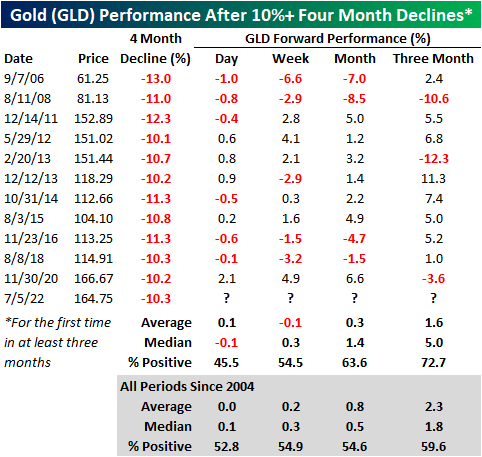
Over the last four months, GLD has declined by 10.3%, which is elevated for a relatively stable asset during a bear market. Since its inception in 2004, GLD has declined 10% or more over a four-month period (with no occurrences in the prior three months) twelve times with each occurrence shown in the chart below.

The forward performance following four-month declines of 10%+ has been mixed depending on the time frame. The next day (which would be today), GLD has booked a median loss of 10 basis points, gaining just 45.5% of the time. However, the median return and positivity rate in the next week is inline with historical averages. Over the one and three months, performance tends to pick back up, registering gains 63.6% and 72.7% of the time, respectively. Over the next three months, GLD has had a median gain of 5.0%, which is more than two and a half times the median of all periods. Click here to learn more about Bespoke’s premium stock market research service.
Jul 6, 2022
So far in 2022, sky-high commodity prices have plagued equity markets. As input prices have surged for corporations, consumers have faced record-high gas prices, and families are forced to spend A LOT more on food. This has led to a compression in discretionary budgets among consumers, record-low consumer confidence readings, and multi-decade lows in investor sentiment. Yesterday, commodity prices fell sharply as speculators feared demand destruction due to rising recessionary risks. Although the reasoning for the selloff is certainly not positive for the broader economy, investors breathed a sigh of relief as one of the major economic/market headwinds eased. Click here to learn more about Bespoke’s premium stock market research service.
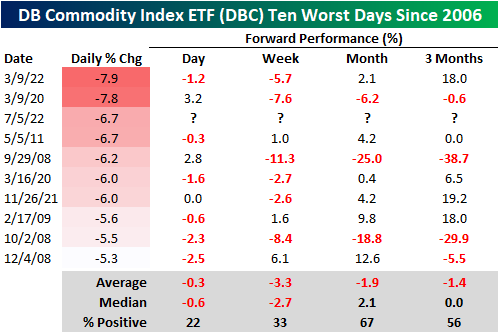
Yesterday’s move was the third-largest downside move in the Invesco DB Commodity Index ETF (DBC) since its inception in 2006, falling short of just two occurrences in March 2020 and March 2022. Following yesterday’s decline, DBC is now down over 18% from its June 9th high and up ‘just’ 20.2% YTD. Over the last 12 months, though, DBC is still up 73.6%.


Following the other nine worst days in DBC’s history, the median forward performance has been relatively weak, which by itself, is a positive for corporations and all other commodity consumers. In the next week, DBC has only performed positively one-third of the time, booking a median loss of 2.7 percentage points. Over the following three months, DBC has appreciated 56% of the time and has tended to remain flat on a median basis. In three of the nine prior occurrences, DBC rallied 18% or more over the next three months, while it declined 29% or more twice. Click here to learn more about Bespoke’s premium stock market research service.
Apr 19, 2022
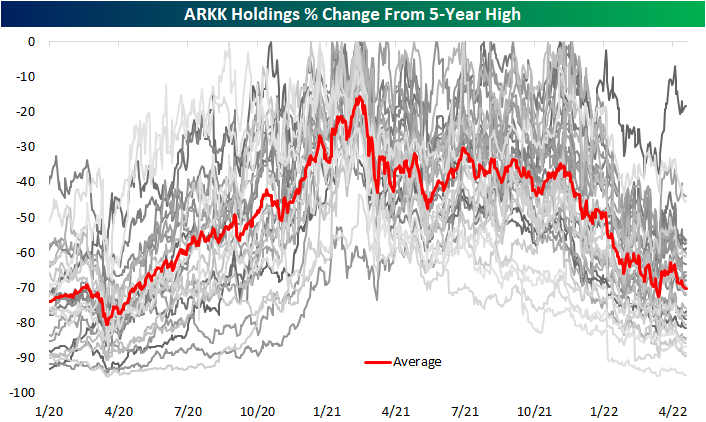
While it is seeing a large bounce today currently up 5% as of this writing, Cathie Wood’s flagship fund, the ARK Innovation ETF (ARK), has had a rough go of it over the past year and change. The ETF peaked in February of last year and has fallen over 60% in the months since then, erasing the entirety of the post-pandemic rally. As for the current holdings making up the ETF, everything has pulled back from post-pandemic highs which were mostly set either in early 2021 or late 2021. To highlight this, in the chart below we show each current holding’s change (in percentage terms) from its respective 5-year high. The average holding is currently down over 70% from its high. (ARKK holdings are released daily at ARK’s website.)
Below is a snapshot of current ARKK holdings and where they’re trading relative to 5-year highs. Year to date, only one stock in the ARKK ETF, Signify Health (SGFY), has managed a positive move as the average YTD decline currently stands at 40.8%. That being said, SGFY is still down over 60% versus its February 2021 high. As previously mentioned, most other holdings similarly peaked in the first quarter of last year while many others peaked more recently last fall. As shown in the table, the average peak date for all ARKK holdings was 3/11/21.
One of the stocks that hit a high last fall is the mega-cap EV giant Tesla (TSLA). Since its November 4th, 2021 high, TSLA has fallen only 18.41%, and it is only down 5% year to date. Even though hardly anyone would wish to see an investment lose nearly a fifth of its value, that is a substantially better result than most other ARKK holdings. For example, Berkley Lights (BLI) down 94% from its 5-year high, while 43% of the ETF’s holdings have fallen by at least 75%. Given that TSLA is by far the largest ARKK holding with a 10.55% weight, its smaller decline relative to the rest of the ETF’s holdings has helped ARKK from falling even more.
With the average ARKK stock down 70% from its 5-year high, it’s going to take a huge rally in the “growth” space to get back to prior levels. As shown at the bottom of the table, the average stock in the ETF now needs to rally 348% to get back to prior highs! Click here to learn more about Bespoke’s premium stock market research service.

Bespoke Investment Group, LLC believes all information contained in this report to be accurate, but we do not guarantee its accuracy. None of the information in this report or any opinions expressed constitutes a solicitation of the purchase or sale of any securities or commodities. This is not personalized advice. Investors should do their own research and/or work with an investment professional when making portfolio decisions. As always, past performance of any investment is not a guarantee of future results. Bespoke representatives or clients may have positions in securities discussed or mentioned in its published content.
Apr 14, 2022
After coming in at one of the lowest levels on record last week, seasonally adjusted initial jobless claims bounced up to 185K this week. While higher, jobless claims are still historically strong having spent a record eight straight weeks with sub-200K readings.

As we noted last week, seasonal adjustments overstated the strength of claims as unadjusted claims experienced a seasonally unusual decline. This week was more normal from a seasonal perspective with initial claims rising from 194.4K to 222.5K and the first reading above 200K since the week of March 11. As shown in the second chart below, the current week of the year has consistently seen claims move higher week over week marking a temporary high before resuming the seasonal downtrend through the next couple of months. That means the slight uptick this month is likely mostly seasonal and far from any sort of a change in trend.

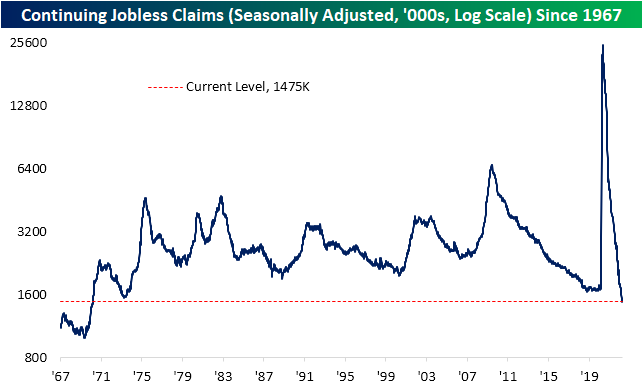
Lagged one week to initial claims, continuing jobless claims fell to a new low of 1.475 million. That is the lowest level of claims since March 1970. Click here to view Bespoke’s premium membership options.