May 3, 2022
The sell-off in bond prices over the last six months has been extreme to say the least. There are a number of ways we could highlight the carnage for bond investors, but one way is to look at how far bond indices are trading below their 200-day moving averages. As shown below, the Bloomberg US Aggregate Bond Market Total Return index is currently 8.5% below its 200-day moving average.

Going back to 1988 when daily price data begins, the 200-DMA spread is currently 2x more negative than any prior extreme oversold reading. Click here to learn more about Bespoke’s premium financial markets research.

May 2, 2022
It’s been a monster year for cruse oil and it continued in April. For the month, WTI rallied 4.4% and finished the month at $104.7 per barrel. This comes as Russian supply has been essentially cut off from Western markets, the Saudis hold back supply, and US drillers are in the process of ramping up capacity to meet demand, which is a process that takes several months to complete. Most notable about April’s rally was that it marked the fifth consecutive month in which WTI rallied, which is tied for the second-longest streak on record (since 1983). The only streak that was longer was in late 2010/early 2011 when WTI notched eight straight months of gains.

The chart below outlines the long-term price chart of WTI Crude. Two aspects stand out in the chart. First, crude oil tended to see additional gains in the short term following these five-month streaks. Secondly, it is also worth noting that three of these occurrences happened within two years (2009 – 2011), which was likely due to aggregate demand ticking higher as the economy emerged from the Global Financial Crisis. The current period is relatively similar, as the global reopening has put upward pressure on the demand curve after oil producers lowered output during COVID. That increased demand has also been exacerbated by supply constraints following the Russian invasion of Ukraine.
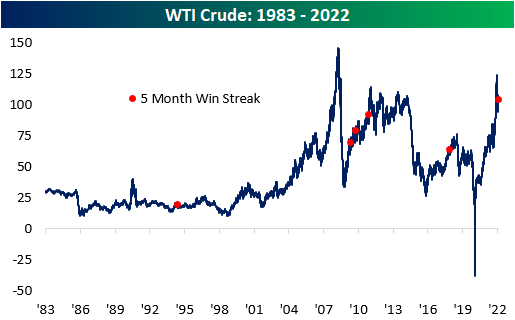
The table below outlines the performance of WTI after the fifth straight month of prior five-month win streaks. WTI tended to trade down over the following month but reversed course to book gains in the following three and six months. In the month following these streaks, WTI averaged a loss of 4.4% (median: -4.8%), booking gains just one time (20%). After three months, WTI averaged a gain of 5.1% (median: 5.5%), performing positively 80% of the time. Over the next six months, average performance and positivity rates declined to 1.9% and 60%, respectively.
Higher oil prices affect energy prices, shipping rates, and the cost of so many more secondary products. Therefore, higher oil prices tend to be inflationary and crimp corporate margins as well as consumer buying power. Historically speaking, though, the S&P 500 has averaged a gain of 8.3% (median: 12.1%) during these streaks, which is 420 basis points higher than the average performance for all five-month periods since 1983. In the month following these streaks, the S&P 500 has averaged a gain of 1.4% (median: 3.2%), which is higher than the historical average as well. In the next three months, the index has averaged a gain of 4.5% (median: 4.9%) with positivity rates higher than that of all periods. Similar to what we see in the six-month performance of WTI, positivity rates moderate for the S&P 500, with average six-month gains of 3.2% (median: 0.2%) versus around 5% for all six-month periods since 1983. Click here to view Bespoke’s premium membership options.

Apr 26, 2022
The Richmond Fed’s manufacturing survey was released this morning showing a modest improvement in conditions in the month of April. The headline number rose by a point to 14 which is still in the middle of the pandemic range of readings and the highest level since December.

In spite of the improvement in the composite index—a weighted average of shipments, new orders, and employment—the breadth of this month’s report was negative with over half of the categories declining month over month. Two of those declining categories were new orders and employment which are again inputs for the composite. That means the higher reading of the composite was entirely thanks to the 8-point increase in shipments.
Looking across other areas of the report, expenditures were weaker while inventories are recovering from historic lows. While business conditions are mixed to deteriorating, supply chains are showing signs of improvement as evidenced by the increase in shipments.
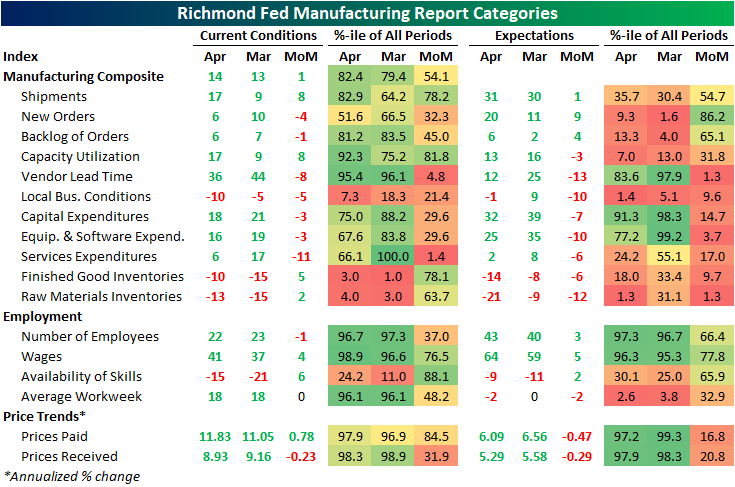
While shipments were an area of strength, another input to the composite, new orders, fell 4 points and is back near the middle of its historical range. Expectations, however, experienced a sizeable rebound with that index rising 9 points. While that increase bucks the trend of weak expectations readings relative to current conditions that we have seen in other regional Fed surveys (which we discussed in last night’s Closer), this index’s increase was the exception rather than the rule. As shown in the table above, only a handful of other expectations categories rose month over month with many declines ranking in the bottom decile of monthly moves.
The big increase to shipments left that index at the highest level since last July as backlog of orders are growing at a substantially more modest pace compared to earlier in the pandemic. One likely reason that both of these readings are improving is a coincident improvement in supply chain stress. The index for lead times saw an 8-point decline ranking in the bottom 5% of all monthly moves. That leaves the index one point above the December low of 35.

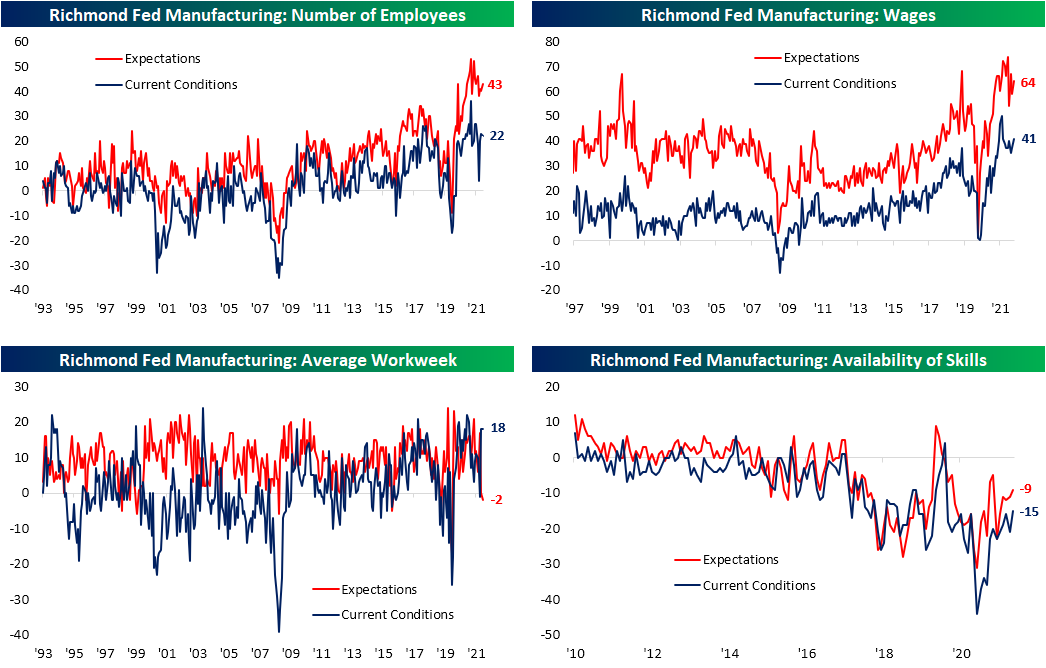
Employment metrics were mixed this month. The region’s firms are still hiring on a net basis, but hiring has peaked and declined again in April. That was in spite of firms also reporting better availability of workers with in-demand skills as that index rose to the highest level since July 2020. With that being said, the negative number indicates a still insufficient supply of quality talent. Wages, meanwhile, saw one of the larger increases in recent months rising to the highest level since September. The average workweek was unchanged at a healthy level in the top 5% of its historical range, but expectations are calling for declines in hours worked on the horizon. Click here to learn more about Bespoke’s premium stock market research service.
Apr 25, 2022
It was another weaker than expected regional manufacturing report this morning as the Dallas Fed’s survey came in at 1.8. The index was expected to decline, but to a more modest reading of 3.5 from last month’s level of 8.7. With expectations declining hand in hand, this report indicates southern manufacturers have seen a significant deceleration in growth and also expect that to continue in the future as the indices for current and future conditions are around the weakest of the pandemic.

Current condition indices out of Dallas more closely resembled the results of the Philly Fed survey last week with weak breadth and readings falling into the middle of their historical ranges. However, like both the Philly and Empire Fed readings, expectations are deteriorating much more quickly than current conditions. As shown below, while many current condition indices are at worst in the middle of their historic ranges, some expectations indices have fallen into the bottom decile of readings after historically large declines month over month in April. For example, the decline in expectations for New Orders ranks in the bottom 1% of all month-over-month moves.
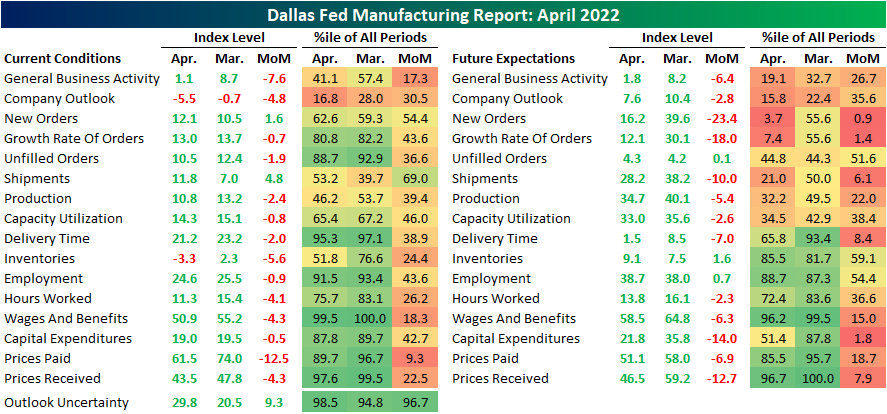
Two indices for current conditions were in contraction in April. The first was inventories while the other, and more negative, was company outlook. This index is now at its lowest level since the historic lows set in the spring of 2020. While still positive, the same can be said for expectations as they have breached new lows as well. That means on net more reporting firms are seeing economic conditions deteriorating than improving.

At the moment, demand has held up with the index for New Orders ticking up slightly though it is well below levels set earlier in the pandemic. As such, Unfilled Orders are still growing but at a slower rate as Shipments saw a modest increase off of post-pandemic lows. Again, in spite of any improvements reported in current conditions, Texas manufacturers do not expect much good to come on the horizon. The monthly declines in expectations for New Orders and New Order Growth Rate rank in the bottom 1% and 2%, respectively, of all monthly changes. While it was not as large of a drop, shipments similarly experienced a sharp decline ranking in the bottom few percentiles.

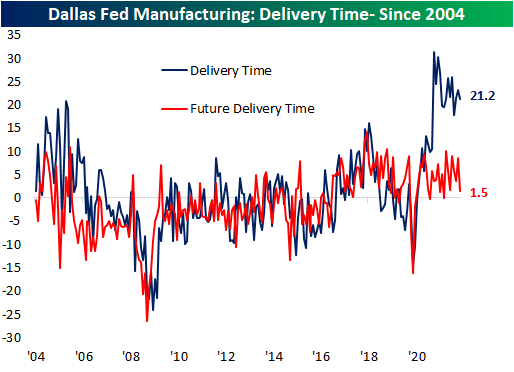
As for one silver lining of the report, there was further evidence of easing of supply chain stress with the Delivery Time index falling to 21.2. This index has been consistently falling over the past year. Expectations saw a coincident decline.
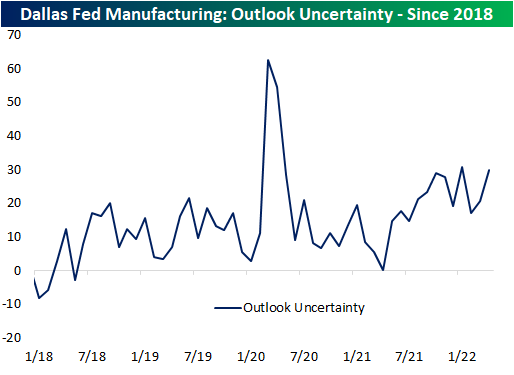
The Dallas Fed also includes in the report an index on uncertainty; a newer index only dating back to 2018 tracking the change versus the prior month in the firm’s uncertainty about company outlook. This index has returned to the upper end of its range near 30. That is slightly below the January reading for the highest levels in the series’ history outside of the beginning of the pandemic.
Be sure to check out tonight’s Closer which will provide an update of our Five Fed Manufacturing Composite, which combines these Dallas Fed readings with those of the Empire and Philly Fed surveys to gauge overall national manufacturer activity. Click here to view Bespoke’s premium membership options.
Apr 21, 2022
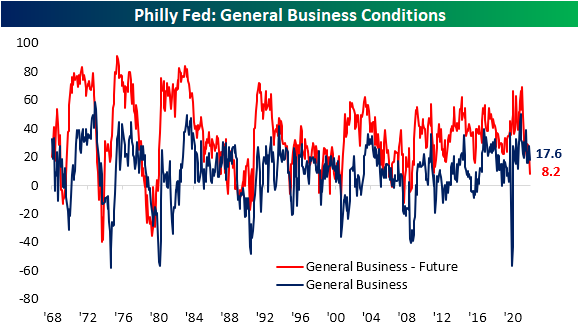
Today’s release of the Philadelphia Fed’s Business Outlook survey essentially saw the opposite results of last Friday’s Empire Fed release. Whereas the New York Fed’s headline number surged, the Philly Fed reading dropped from 27.4 to 17.6, well below expectations of 21.4.
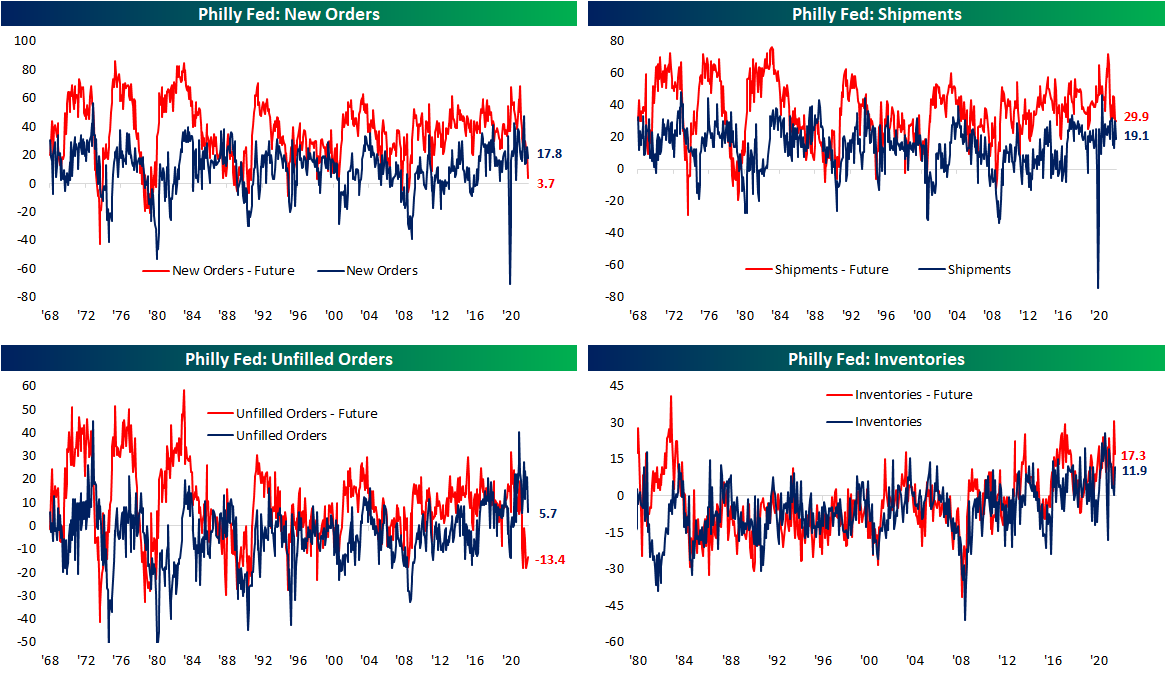
Even though current conditions indices of the two regional Fed surveys released so far this month mirrored one another, both were on the same page for future expectations. Like the Empire Fed, the Philly Fed saw broad declines across expectations indices. In fact, the only index that rose month over month was Unfilled Orders.

The April report showed a notable slowing of demand as New Orders fell 8 points, and that was the best of any demand-related index. Shipments and Unfilled Orders both dropped double digits. While still indicative of growth, just at a slower rate, these indices have fallen from upper quintile readings down to the 60th percentile range. Expectations indices are far more depressed. New Orders and Unfilled Orders are only in the 5th and 6th percentiles of their historical ranges, respectively. Ironically, Unfilled Orders was also the only expectations index to move higher in April. Inventories remain more elevated for both indices for current and future conditions. The former rose back into the upper decile of its range as the latter moderated from a 99th percentile reading last month.
As we noted earlier this week, one hopeful sign for supply chains from the Empire Fed survey was a dramatic improvement in Delivery Times. That was echoed in today’s release. The index sat just off record highs last month but after its third-largest month over month decline on record, the index has fallen all the way back down to 17.9 which is the lowest level since last February. Responding firms also report that they expect delivery times to decline in the future meaning more improvements in supply chains are expected.

Even though supply chains might not be as constrained, that does not mean firms are not paying less. The index for Prices Paid hit a new high for the pandemic with the index rising to 84.6. That is now the highest reading since June 1979. As for how those increases are being passed to consumers, Prices Paid remain off the peak from this past November with only a slightly higher reading month over month in April.

While Prices Paid came close, it was not able to set a record high this month. The index for Number of Employees however did. Moving higher for the third month in a row, this index hit a new record high of 41.4. That means Philly area manufacturers are taking on the highest number of new workers since the beginning of this survey in 1968! The average workweek remains historically elevated and off of recent lows, but that is also well below the highs earlier in the pandemic. Expectations however saw the first negative reading since February 2016. In other words, with a larger number of new hires coming on board, the average workweek is expected to shorten in the near future. Click here to view Bespoke’s premium membership options.
