Apr 19, 2022
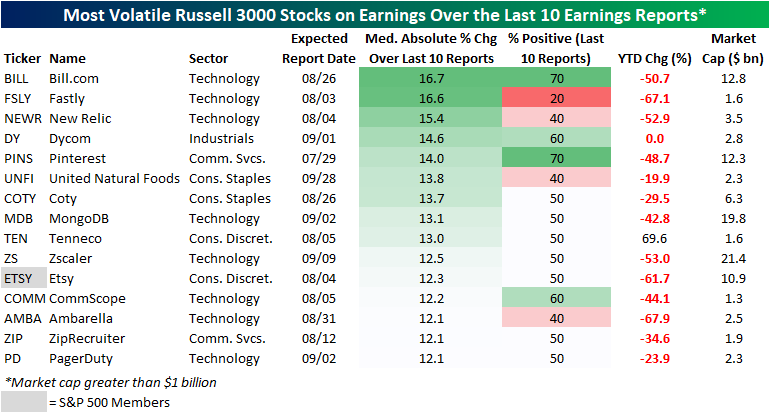
Trading stocks around earnings results can prove to be a daunting task, as the market’s reaction isn’t always what you’d expect. Nonetheless, today we outline 40 S&P 1500 stocks with market caps above $5 billion that are yet to report earnings where analysts expect strong YoY sales growth and positive earnings growth this quarter. Of these 40 stocks, ten are from the Energy sector, six each are from Consumer Discretionary and Technology, and five each are from the Materials and Industrials sectors. Apart from the Utilities and Communication Services sectors, every major sector is represented on this list. Even though these names are expected to experience significant y/y top and bottom line growth in their upcoming earnings reports, the average stock on this list trades at 18.1 times earnings and 3.6 times sales, with a median price to book multiple of 3.2. Additionally, the median stock on this list is 9.3% off its 52-week highs. As always, this list is meant to be a starting point for further research and is not a recommendation to buy or sell any specific securities. If you are interested in earnings season analysis, check out Bespoke’s Conference Call Recaps to stay on top of key earnings reports.

Below we summarize the reasoning behind the strong earnings expectations for each stock on the list:
Coterra Energy (CTRA) is a beneficiary of higher oil & natural gas prices. In FY 2021, the company had an average selling price of $60.35 when accounting for derivative settlements. With prices per barrel above $100 and robust demand, this company’s y/y revenues are expected to grow over 200%. For the natural gas segment, the company can expect the average price per thousand cubic meters to increase by about 2.5 fold, unless the use of derivatives significantly hampers selling prices. CTRA trades at a discount to the broader energy industry on a P/E basis.
CF Industries (CF) is a beneficiary of Russian sanctions, as the company manufactures and distributes fertilizer-related products across North America. Russia is the leading producer of fertilizer-related products (such as ammonia), so the sanctions from the West will cause other market participants to pick up the slack. The supply-restricted industry conditions could lead to higher average selling prices and higher volumes for US producers such as CF.
Southwest Airlines (LUV) is a major US airline that is set to benefit from improving rates of travel in Q1. Although the y/y growth will likely be substantial, travel volumes will still be below that of Q1 2019 based on Delta’s (DAL) recent report. Travel trends do appear positive for leisure and business alike, but the industry still has room to recover as resembled through TSA throughput volumes. Although TTM EPS is negative, LUV trades at a discount in terms of P/S relative to the industrials sector.
Matador Resources (MTDR) explores, develops and produces oil and natural gas resources within the US. This company benefits from the same tailwinds as CTRA, but tends to hedge the price of oil at a lesser rate, thus leading to increased upside potential in their Q1 earnings report.
Mosaic (MOS) is the largest producer of potash and phosphate fertilizer in the US, so the company is exposed to the same secular tailwinds as CF. MOS trades at a discount to the Materials industry based on the current P/E ratio.
Moderna (MRNA) has become a household name due to their swift development of the COVID vaccine, which generates the vast majority of revenues for the company. The brand recognition achieved from this accomplishment should help the company develop and commercialize vaccines and treatments moving forward, but the sequential growth rate in revenue will likely be hampered in the quarters to come. The stock trades at a steep discount to the broader Health Care sector on a P/E basis, but vaccination rates have declined in the US as COVID becomes endemic and almost everyone that wants a vaccine has already been jabbed.
Devon Energy (DVN) engages in the exploration, production and distribution of natural gas liquids and oil, which gives the company exposure to many of the energy tailwinds outlined previously.
HF Sinclair (DINO) is the fourth energy company on this list, manufacturing products such as gasoline, specialty lubricants and chemicals and modified asphalt. The diversified business model allows for the company to capitalize on higher oil prices as well as increased infrastructure spending. This is the cheapest stock on the list on a P/S basis.
Independence Realty Trust (IRT) operates as a REIT with a particular focus on residential housing. The industry-wide housing shortage allows for the company to capitalize on higher rental prices, as the lack of available homes forces certain individuals to rent instead of purchase. Moving forward, IRT can benefit from a demand reduction in home purchasing, as would-be buyers turn to short-term rentals.
Pool (POOL) is one of the world’s largest distributors of supplies and equipment for swimming pools. With recreational centers reopening and a significant increase in in-ground pools across the US since the beginning of the pandemic, POOL should experience secular tailwinds for the foreseeable future. POOL does trade at a slight P/E discount relative to the broader consumer discretionary space, but the stock is by no means cheap at 15.5 times book value.
Diamondback Energy (FANG) is exposed to the same tailwinds as the other energy names on this list, and trades at a steep discount to the energy sector on a P/E basis. The company has expanded drilling capacity in the last twelve months, so the company should realize strong gains due to both volume increases and favorable pricing.
ConocoPhillips (COP) competes in the energy sector and trades at a narrow P/E discount relative to the industry.
Pfizer (PFE) competes in the healthcare space, with primary exposure to the pharmaceutical and biotechnology industries. Vaccine sales are expected to prop up sales figures, and international sales margins for vaccines are expected to drive a more-than-doubling in EPS. The stock trades at a steep discount to the broader health care space on a P/E basis.
Webster Financial (WBS) is a commercial bank with a regional focus on the Northeast. The company focusses on serving individuals and corporations, delivering banking needs such as loan origination, deposit services and wealth management. Rising rates help expand bottom-line margins, and strong economic activity should lead to strong revenues in the coming quarter.
ICU Medical (ICUI) brings medical technology to market with a particular focus on critical care applications. As COVID becomes endemic, we can expect ER visits and surgical volumes to increase as there is a perceived decrease in risk within this space. The stock trades at a significant premium to the broader health care space in terms of P/E, but the P/S and P/B ratio are not necessarily outlandish.
Tesla (TSLA) is a beneficiary of the secular shift to EVs, an improving supply chain situation and limited vehicle inventories. With gas prices sky rocketing, the attractiveness of EVs increases, and TSLA continues to try and perfect production capacity. TSLA vehicles tend to sell almost as soon as they hit the market, but the stock trades at a significant premium relative to its industry, regardless of how you look at it.
ONEOK (OKE) is yet another energy company with a focus on natural gas. The company has been a beneficiary of the tailwinds outlined earlier and trades at a slight premium to the broader industry.
Chevron (CVX) trades inline with industry averages and the company has a particular focus on oil. The company is more geographically diversified than most energy companies, with a presence in more than 180 countries.
Realty Income (O) operates as a REIT that focuses on single-tenant commercial properties. The company has exposure to the UK, EU and the US. With the global economy having reopened, restrictions lifting, and property values inflating, O can benefit from a variety of secular trends. The stock trades at a slight discount to the real estate industry (on a P/E basis) and is relatively cheap on a P/B basis.
Churchill Downs (CHDN) operates a portfolio of gambling locations, including racetracks, casinos and online gambling. With COVID restrictions lifted and states increasingly accepting online gambling, CHDN stands to benefit, however, a decrease in discretionary spending can hamper revenues.
Advanced Micro Devices (AMD) is one of the innovation leaders within the semiconductor space. With increased gaming and high performance computing demand, AMD is positioned to expand on both the top and bottom line for the foreseeable future. Supply chain constraints have shown signs of easing, which should allow for further expansion.
Watsco (WSO) is one of the largest distributors of refrigeration equipment, air conditioning and heating equipment and supplies. As long as infrastructure spending and real estate demand remains strong, WSO should experience tailwinds.
Analog Devices (ADI) is a semiconductor producer that specializes in data conversion, signal processing and power management. With digitalization occurring across every industry, ADI should benefit from the same secular tailwinds as AMD. The stock does trade at a discount relative to the technology space with a relatively low P/B and P/E ratio.
Parker-Hannifin (PH) focuses on motion and control technology as well as filtration and engineered materials. The company has significant exposure to the aerospace industry, so the passing of the defense budget and increased infrastructure spending should provide a tailwind to revenues.
Vulcan Materials (VMC) is a leading producer of construction aggregates with a focus on crushed stone, gravel, asphalt and concrete. Increased infrastructure spending drives revenues for this stock, which trades at a significant P/E premium relative to the broader materials sector.
SolarEdge (SEDG) competes in the solar energy space, which should experience tailwinds as alternatives (oil & natural gas) appear less attractive due to price increases. Additionally, the push to “net-zero” should accelerate revenues moving forward. The stock trades at a significant valuation premium regardless of how you look at it.
Choice Hotels (CHH) owns a variety of hotel chains, ranging from discount to upscale options. As travel resumes for business and pent-up leisure travel demand hits the market, CHH is positioned to benefit. The stock trades inline with sector averages on a P/E basis, but the P/B multiple is extremely elevated.
Teledyne (TDY) is an industrial conglomerate with a focus on technology that senses, transmits and analyzes information. The end-uses for TDY’s products are endless, and the company benefits from increased infrastructure spending, a wide-scale focus on automation and strong economic activity. The stock trades at a discount to sector averages (on a P/E basis), but the P/B and P/S ratio imply that a solid portion of growth is priced in.
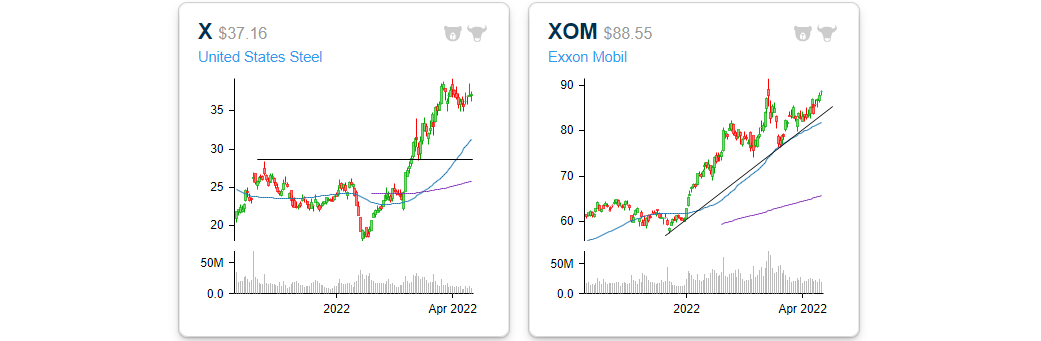
Exxon (XOM) is an energy producer with a primary focus on oil. The stock trades at a slight discount to market averages in terms of the P/E ratio.
Regal Rexnord (RRX) sells motor equipment and products with a primary focus on North America. These parts are used in a variety of end-markets, and the company benefits from increased infrastructure spending, strong economic activity, and an increased focus on automation. The stock trades at a significant discount to the broader industrials space and less than book value.
Murphy USA (MUSA) operates retail gas stations that tend to be located close to Walmart (WMT) stores. This strategic focus essentially guarantees considerable traffic. With high gas prices and relatively steady margins, MUSA should expect top and bottom line expansion. The stock trades at a discount to the energy space on a P/E basis, but the P/B ratio of 7.1 is considerably high.
Lithia Motors (LAD) is a US automotive dealership company that has benefitted from increased automotive prices but has been constrained due to limited inventory levels. As supply chain issues abate, the average selling price will likely decrease but volume should more-than make up for these losses.
US Steel (X) is one of the largest distributors of steel that benefits from increased infrastructure spending and strong economic activity. The pricing of inputs has certainly increased as of late, but the company has been able to pass these costs onto the purchasers. .
S&P Global (SPGI) is a financial company that provides credit ratings, indices and analytics to the investing community. Investing & trading has become increasingly prevalent in younger generations, which may help revenues moving forward. However, decreased trading volumes and poor market performance (particularly in debt markets) can negatively impact results. The stock trades at a premium relative to the financials sector on a P/E basis, and the P/S and P/B ratio appear extremely elevated as well.
Marathon Oil (MRO) competes in the energy sector with a primary focus on oil. The stock trades at a slight discount to sector averages on a P/E front.
Enphase Energy (ENPH) is a leader in the alternative energy space, providing clean energy solutions, software-driven home energy storage equipment, and e-monitoring offerings. As traditional energy sources remain pricey, consumers are increasingly likely to turn to alternatives to maximize efficiency and minimize costs. ENPH trades at aggressive multiples no matter how you look at it.
Carlisle (CSL) is a diversified industrial company that distributes its products globally. The company has a primary focus on construction materials, interconnect technologies and fluid technologies. This stock is exposed to the same secular trends as the other industrial companies on this list, and the stock trades at a premium relative to the industrials sector.
Martin Marietta (MLM) utilizes natural resources to supply aggregates and building materials to the construction industry. With strong housing demand, increased infrastructure spending and strong commercial activity, MLM is poised to benefit from secular trends. The stock trades at a significant premium to the averages of the materials sector, but the specific focus on construction may aid growth for the next few quarters.
Steel Dynamics (STLD) is exposed to the same trends as X, as their business models are quite similar. The stock does trade at a premium relative to X but at a discount relative to the broader materials industry.
Molson Coors (TAP) is a manufacturer and distributor of alcoholic beverages. This company benefits from the global reopening, but is constrained by supply chain woes, rampant inflation, and a shift in consumer preferences. TAP’s exposure to a variety of headwinds without significant tailwinds (relatively speaking) has pushed valuation figures to relatively low levels, trading below average on a P/B, P/E and P/S basis compared to its sector.
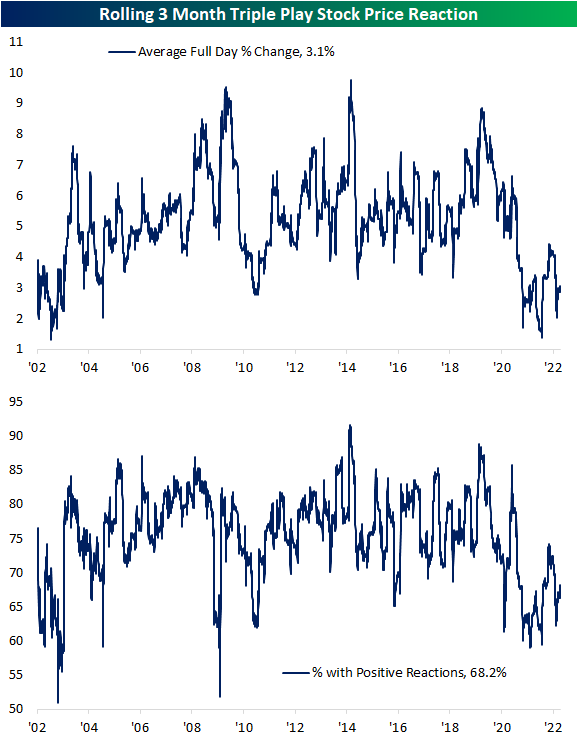
The table below summarized the earnings performance of the 40 names outlined above. The median sales beat rate of these names is 50%, whereas the median EPS beat rate is 65%. The overall positivity rate for performance in reaction to earnings is 53% on a median basis, while the performance in reaction to Q1 earnings is only positive 48% of the time (on a median basis).

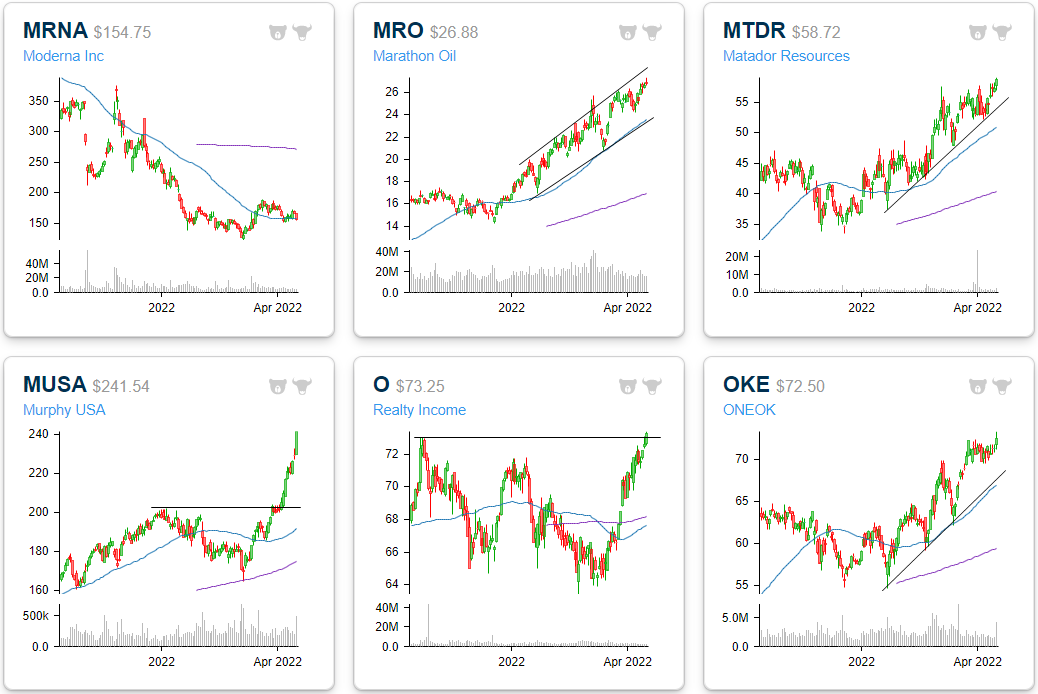
Below we provide six-month price charts of these 40 stocks. Click here to view Bespoke’s premium membership options.


Bespoke Investment Group, LLC believes all information contained in this report to be accurate, but we do not guarantee its accuracy. None of the information in this report or any opinions expressed constitutes a solicitation of the purchase or sale of any securities or commodities. This is not personalized advice. Investors should do their own research and/or work with an investment professional when making portfolio decisions. As always, past performance of any investment is not a guarantee of future results. Bespoke representatives or clients may have positions in securities discussed or mentioned in its published content.