Aug 18, 2022
As we mentioned in today’s Chart of the Day, there can be a wide spread between total returns and price change based on dividend yield. Although it doesn’t always make financial sense for a company to pay dividends, they can certainly magnify returns all else equal. Click here to start a two-week trial to Bespoke Premium and receive our paid content in real-time.
The table below outlines twenty S&P 500 stocks that have seen a high percentage of their returns over the last twenty years come from dividends. The average stock on this list has seen over 80% of their gains over the last two decades come from dividends alone. Although the average stock on this list has only seen a price gain of 61.1% since August of 2002, their average total return when factoring in dividends re-invested has been 278%.

To show you what we mean, below is a chart of price change versus total return over the last 20 years for Altria Group (MO). As you can see, the dividend in this case turns a below average stock into an outperformer. Click here to start a two-week trial to Bespoke Premium and receive our paid content in real-time.

Jun 13, 2022
In recent years, one of the major arguments made for equity market bulls was the fact that there was no alternative (TINA). TINA was a tough strategy to argue against as fixed income markets were offering incredibly low, if anything in the way of yields, especially relative to inflation expectations. However, the Fed’s hawkish pivot has caused yields to tick significantly higher, reaching the highest level in about a decade in early June. This certainly changes the investment landscape, as alternatives to equities become more attractive and the discount rate used to revert future corporate cash flows to present-day dollars increases.
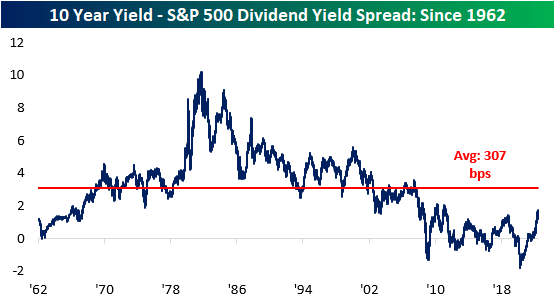
The 10-year Treasury note is now offering investors a yield of 3.4%, which is more than 2 times higher than the level at the start of the year. Notably, the current 10-year yield of 3.4% is 172 basis points higher than the dividend yield of the S&P 500 (which is 1.6%). This widening spread decreases the attractiveness of equities and increases the appeal of fixed income assets, which can lead to further downside in the S&P 500. Although the spread has moved significantly higher as of late, it is still compressed relative to historical averages, meaning that yields could still rise further and the spread between long-term Treasuries and the S&P 500’s dividend yield would be narrower than the long-term average.
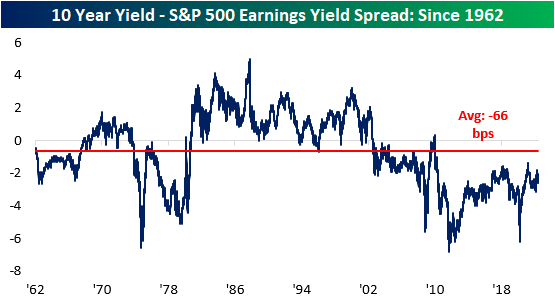
Another metric worth tracking is the earnings yield of the S&P 500 versus the 10-year yield. The earnings yield (the inverse of the P/E ratio) is currently 218 basis points higher than the 10-year yield. If this spread were to turn negative, it would imply that risk-free assets would be generating superior earnings than riskier equities. Nonetheless, the S&P 500 earnings yield is still well above that of the 10-year yield, so equities do still appear attractive on an absolute basis, implying that investors are still being compensated for the excess risk taken by investing in public equities. Throughout history, there have been periods where the earnings yield was less than the 10-year yield for extended periods of time, and while this would seem counter-intuitive, unlike fixed income, where capital appreciation is capped, capital appreciation for equities is theoretically unlimited.
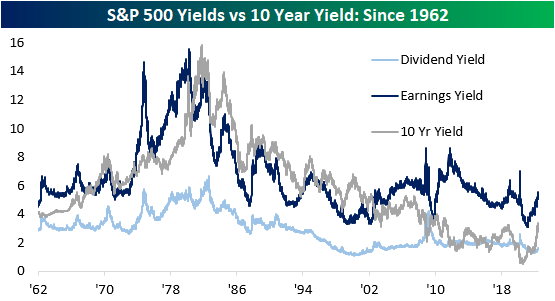
The chart below aggregates the S&P 500 earnings yield, dividend yield, and the 10-year treasury yield. As you can see, the earnings yield has been higher than the treasury yield since 2002. The tightening of this spread decreases the attractiveness of equities relative to 10-year Treasuries, which we have seen occur over the last several months. Click here to become a Bespoke premium member today!
Apr 22, 2022
This week’s Bespoke Report newsletter is now available for members.
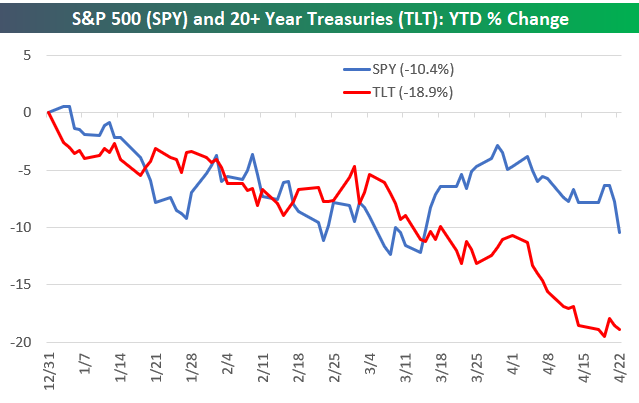
Early Thursday morning, investors were feeling pretty good about the trading week. At that point, the S&P 500 was up 1% on the day and about 2.7% week-to-date, and the index had actually just pushed back above its 200-day moving average.
There was nothing we could identify in the news that caused the S&P to peak around 10 AM ET, but from that point through the closing bell on Friday, the index fell 5.3% in basically as straight of a line lower that you can draw.

Fed Chair Powell did, however, make comments in a speech at the IMF mid-day Thursday where he confirmed that a 50 basis point hike was “on the table” for the May meeting. Markets have been pricing high odds for 50 bps hikes for some time now, but Powell’s comments basically cemented them (for now).
The Powell Fed is known for its jawboning and transparency when it comes to the path for rates. The chart below of equities and fixed income in 2022 tells you what these two asset classes currently think of that jawboning:
The snippet above is pulled from a page from this week’s Bespoke Report newsletter. If you’re not a Bespoke subscriber and you want to read this week’s full Bespoke Report (and access everything else Bespoke’s research platform has to offer), start a two-week trial to one of our three membership levels.


Apr 11, 2022
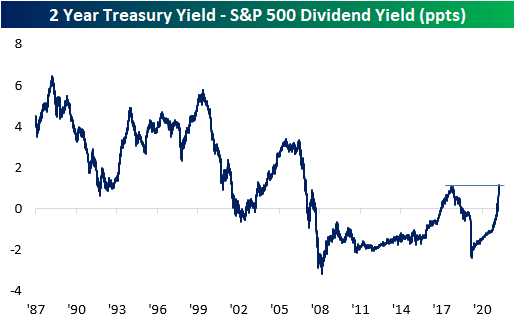
Since mid to late-2019 when interest rates really started to fall, the dividend yield on the S&P 500 consistently provided a higher yield than the two-year US Treasury. With a higher payout plus the potential for price appreciation, equities looked more attractive to many investors. The period from the Financial Crisis through 2017 also saw a similar setup where the S&P 500’s dividend yield was higher than the yield on the 2-year, but before the Financial Crisis and the FOMC’s zero-interest-rate policy, it was extremely uncommon for the S&P 500 to yield more than the two-year Treasury. This year has caused a tidal shift in the balance of power in yield between the S&P 500 and the two-year Treasury. As the Fed came to the conclusion that inflation wasn’t as transitory as originally thought and found itself behind the inflation curve, it shifted from a much more accommodative stance to one that was more biased towards tightening, and that shift resulted in one of the most rapid increases in two-year Treasury yields in decades. In the process of this spike in rates, back in February, the yield on the two-year rose back above the dividend yield of the S&P 500 for the first time since 2019.

As Treasury yields have continued to spike, the premium in yield of two-year Treasuries relative to the dividend yield of the S&P 500 reached an important milestone last Friday (4/8). As shown in the chart below, the spread between their yields widened out to 110 basis points (bps), taking out the high of 108 bps from 2018. At these levels, the spread between the two is now the widest it has been in fourteen years since the Financial Crisis. It started with long-term Treasury yields, but as the overall trend in rates has been higher, most of the Treasury yield curve is now yielding more than the S&P 500. For years now, investors have had a TINA (There Is No Alternative) relationship with the stock market, but as interest rates have shot higher, TINA is taking a backseat to BABY (Bonds Are Better Yielders). Click here to try out Bespoke’s premium research service.
Apr 7, 2022
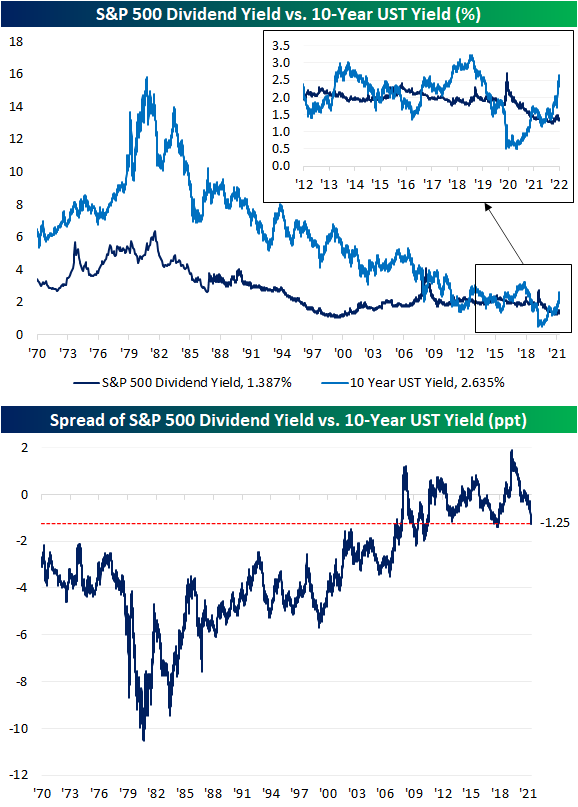
US Treasury yields have experienced a dramatic move higher as the market prices in continued rate hikes in the near future. With the increase in long-term Treasury yields, we’re starting to see what looks like the end of a period where the S&P 500 and the 10-year Treasury fought back and forth over which asset class had a more attractive yield.
As shown in the chart below, from 1970 right up to the period before the global financial crisis, the 10-year yield consistently yielded more than the S&P 500. As the Fed cut rates to zero during the crisis, though, the S&P 500 went on to see multiple periods where its dividend yield was in excess of the 10-year Treasury yield. With the recent surge in yields as the Fed embarks on what the market expects to be an aggressive rate hiking cycle, the script has been completely flipped. The 10-year now offers a roughly 125 bps higher yield than the S&P 500 dividend yield which is the widest spread since the fall of 2018 and before that, the fall of 2011. As the spread between the S&P 500 dividend yield and 10-year Treasury yield hits the low end of the GFC/post-GFC era, we would note that current levels are still roughly 200 bps higher than the historical average going back to 1970. Click here to view Bespoke’s premium membership options.