Aug 12, 2022
We like to use credit default swaps (a product that pays out investors if a reference company defaults) to track risk premiums in the corporate bond market. When risk premiums rise, credit default swaps get more expensive, and the spread implied between risk free rates and CDS rises. Click here to learn more about Bespoke’s premium stock market research service.
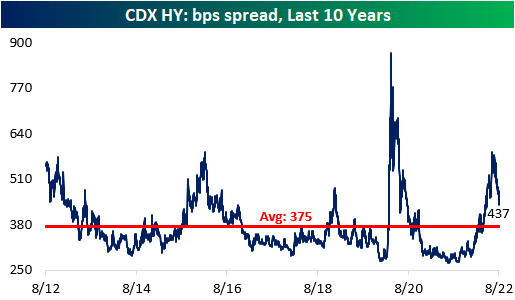
As recession fears intensified throughout the first half of 2022, both the investment grade and high yield credit default swap indices skyrocketed, gaining 106.7% and 110.5% between the start of the year and the highs, respectively. However, earnings were not as bad as feared, economic data is starting to come in better than expected, gas prices have fallen, and CPI seems to have peaked in June. All of this has caused substantial declines in CDS index spreads, with the risk premium associated with each falling by about a quarter since their summer peak.


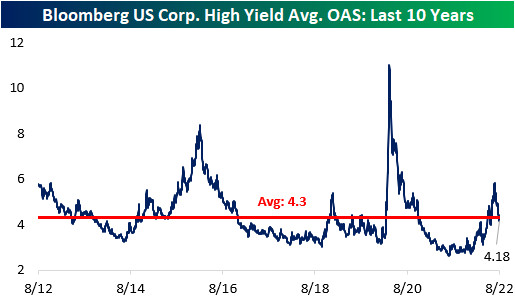
Although CDX High Yield’s spread is well off of its highs, it is still above the average over the last ten years, implying a still elevated risk related to recession and potential defaults. We can also tie CDS indices to the performance of actual corporate bonds. The option-adjusted spread (a proxy for the credit risk over risk-free rates for a given investment) for high yield bonds in the “cash” market has a 0.88 correlation to CDS over the past decade. Notably, the CDX HY spread remains above its long-term average, while that High Yield Average OAS is below its average, implying investors may be getting under-compensated for the risk they are taking in the high yield debt market. Click here to learn more about Bespoke’s premium stock market research service.
Jun 13, 2022
In recent years, one of the major arguments made for equity market bulls was the fact that there was no alternative (TINA). TINA was a tough strategy to argue against as fixed income markets were offering incredibly low, if anything in the way of yields, especially relative to inflation expectations. However, the Fed’s hawkish pivot has caused yields to tick significantly higher, reaching the highest level in about a decade in early June. This certainly changes the investment landscape, as alternatives to equities become more attractive and the discount rate used to revert future corporate cash flows to present-day dollars increases.
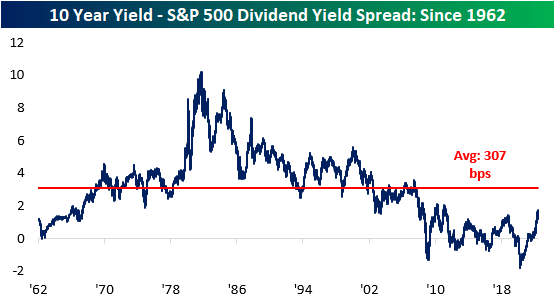
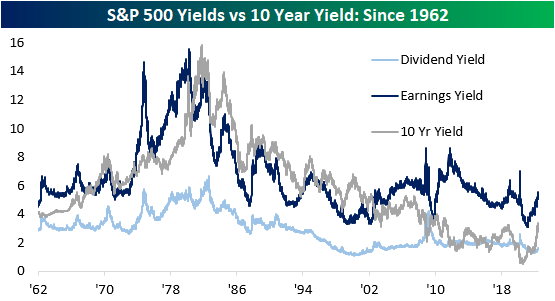
The 10-year Treasury note is now offering investors a yield of 3.4%, which is more than 2 times higher than the level at the start of the year. Notably, the current 10-year yield of 3.4% is 172 basis points higher than the dividend yield of the S&P 500 (which is 1.6%). This widening spread decreases the attractiveness of equities and increases the appeal of fixed income assets, which can lead to further downside in the S&P 500. Although the spread has moved significantly higher as of late, it is still compressed relative to historical averages, meaning that yields could still rise further and the spread between long-term Treasuries and the S&P 500’s dividend yield would be narrower than the long-term average.
Another metric worth tracking is the earnings yield of the S&P 500 versus the 10-year yield. The earnings yield (the inverse of the P/E ratio) is currently 218 basis points higher than the 10-year yield. If this spread were to turn negative, it would imply that risk-free assets would be generating superior earnings than riskier equities. Nonetheless, the S&P 500 earnings yield is still well above that of the 10-year yield, so equities do still appear attractive on an absolute basis, implying that investors are still being compensated for the excess risk taken by investing in public equities. Throughout history, there have been periods where the earnings yield was less than the 10-year yield for extended periods of time, and while this would seem counter-intuitive, unlike fixed income, where capital appreciation is capped, capital appreciation for equities is theoretically unlimited.
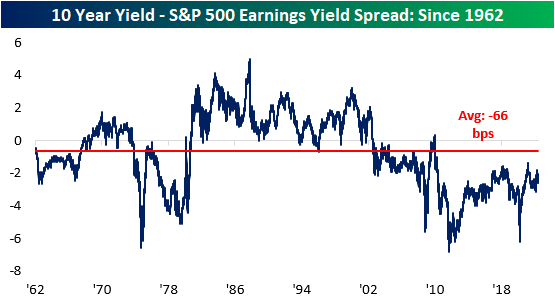
The chart below aggregates the S&P 500 earnings yield, dividend yield, and the 10-year treasury yield. As you can see, the earnings yield has been higher than the treasury yield since 2002. The tightening of this spread decreases the attractiveness of equities relative to 10-year Treasuries, which we have seen occur over the last several months. Click here to become a Bespoke premium member today!
May 3, 2022
The sell-off in bond prices over the last six months has been extreme to say the least. There are a number of ways we could highlight the carnage for bond investors, but one way is to look at how far bond indices are trading below their 200-day moving averages. As shown below, the Bloomberg US Aggregate Bond Market Total Return index is currently 8.5% below its 200-day moving average.

Going back to 1988 when daily price data begins, the 200-DMA spread is currently 2x more negative than any prior extreme oversold reading. Click here to learn more about Bespoke’s premium financial markets research.
