Sep 2, 2022
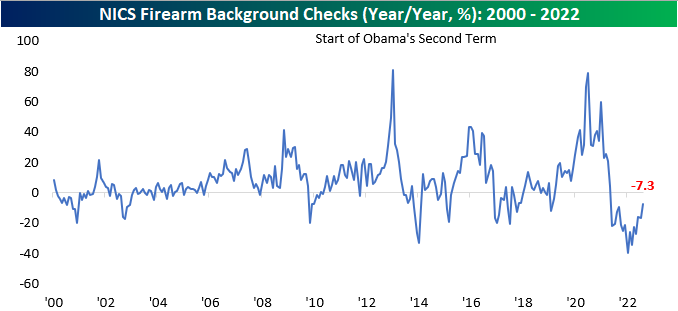
Although not a widely-utilized indicator, we like to look at the number of firearm background checks conducted by the NICS every month to gauge geopolitical uncertainty and volatility within the US. In uncertain times, firearm background checks tend to increase, as individuals increasingly acquire the means to protect themselves in a worst-case scenario. On the contrary, when times are ‘good’, background checks tend to decline. An additional factor that impacts background checks is the outlook on firearms legislation. When the populous fears that they may not be able to purchase certain firearms in the future, they will step up purchases in the short term to ‘stock up’.
At the end of June, the Supreme Court issued a ruling that expanded gun rights, prohibiting certain restrictions on carrying. This may have contributed to the rise in background checks this month, but there are other factors that likely contributed as well. Democrats are now expected to retain control of the Senate according to betting markets, and the Biden administration has proven their ability to enact legislation, so Americans may be worried about further gun control legislation. Additionally, the FBI’s raid of former President Trump’s Mar a Lago home could have added to the perception of domestic political instability. Click here to learn more about Bespoke’s premium stock market research service.
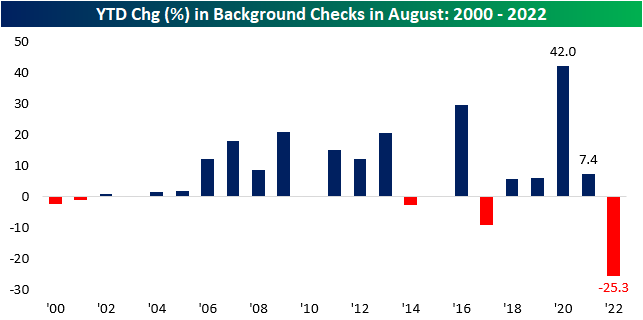
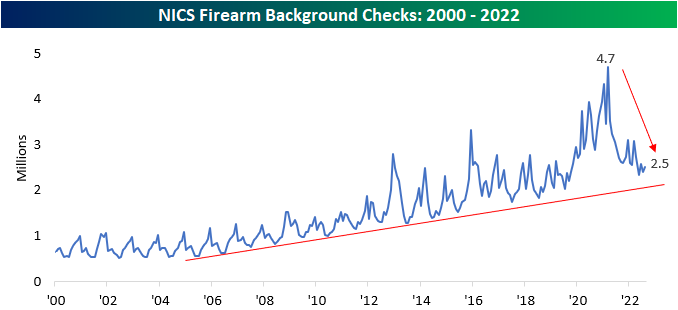
Although background checks rose by 4.7% month over month, they are still down 7.3% y/y. This is largely due to tough comps, as heightened geopolitical uncertainty and volatility in 2020 and 2021 led to extreme increases in background checks. We are now essentially out of the COVID-era, the Russia-Ukraine conflict is no longer top of mind for Americans, and the questioning of 2020 election results appears to be a thing of the past, and a more relaxed state of affairs has led to declines throughout 2022. However, the rate of decline has been leveling out. Through August, the number of background checks on a YTD basis has declined by 25.3%, but the y/y decline of just 7.3% for the month tells us that we have likely already experienced the largest declines in background checks on a percentage basis. It would not be unreasonable to expect checks to rise as we head into midterm elections.
Background checks are still in a longer-term uptrend. At 2.5 million, August’s figure ranks in the top 15.1% of all months since NICS began reporting this data in 1998, and outside of late 2019 through 2021, there were only a few months that the number of checks was higher. Still, they are down 46.3% from the all-time highs seen in March 2021. This may be because demand was pulled forward, but it could also be due to a more normalized domestic situation. Click here to learn more about Bespoke’s premium stock market research service.
Sturm Ruger (RGR) and Smith & Wesson (SWBI) are the two publicly traded stocks with direct exposure to these trends. Historically speaking, the monthly performance of these stocks tends to be correlated to the trailing twelve-month volume of background checks. Although background checks rose month over month, the near-term downtrend persists in checks, which is following through to the performance of these two stocks. Over the last month, RGR and SWBI are down 20.7% and 4.8%, respectively. Click here to learn more about Bespoke’s premium stock market research service.

Jul 6, 2022
So far in 2022, sky-high commodity prices have plagued equity markets. As input prices have surged for corporations, consumers have faced record-high gas prices, and families are forced to spend A LOT more on food. This has led to a compression in discretionary budgets among consumers, record-low consumer confidence readings, and multi-decade lows in investor sentiment. Yesterday, commodity prices fell sharply as speculators feared demand destruction due to rising recessionary risks. Although the reasoning for the selloff is certainly not positive for the broader economy, investors breathed a sigh of relief as one of the major economic/market headwinds eased. Click here to learn more about Bespoke’s premium stock market research service.
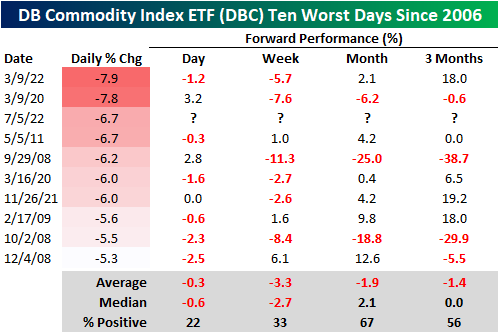
Yesterday’s move was the third-largest downside move in the Invesco DB Commodity Index ETF (DBC) since its inception in 2006, falling short of just two occurrences in March 2020 and March 2022. Following yesterday’s decline, DBC is now down over 18% from its June 9th high and up ‘just’ 20.2% YTD. Over the last 12 months, though, DBC is still up 73.6%.


Following the other nine worst days in DBC’s history, the median forward performance has been relatively weak, which by itself, is a positive for corporations and all other commodity consumers. In the next week, DBC has only performed positively one-third of the time, booking a median loss of 2.7 percentage points. Over the following three months, DBC has appreciated 56% of the time and has tended to remain flat on a median basis. In three of the nine prior occurrences, DBC rallied 18% or more over the next three months, while it declined 29% or more twice. Click here to learn more about Bespoke’s premium stock market research service.
May 24, 2022
In addition to weaker than expected preliminary S&P Global (formerly Markit) PMIs, another weak regional Fed manufacturing index hit the tape this morning. The Richmond Fed’s Manufacturing Composite dropped into contraction in May as the index hit its lowest level in two years. The 23-point month-over-month drop was also the second-largest decline on record behind the 49-point drop in April 2020.

Each regional Fed’s headline manufacturing number differs slightly in composition and the Richmond reading is made using shipments, new orders, and employment as inputs. As shown below, each of those indices experienced historic declines this month causing the massive drop in the composite. Breadth elsewhere in the report was not much better though. Other categories like capacity utilization, order backlogs, and average workweek also pulled back sharply. Meanwhile, expectations for several categories are in the bottom few percentile of their historical ranges going back to the start of the data in the 1990s. Overall, this month’s report showed a massive slowdown in activity that is consistent with other surveys that have come out this month.

Two of the inputs to the composite that also fell into contraction this month were new orders and shipments. New Orders have seen a small handful of larger declines with September of last year being the most recent one. New Orders were also much lower after that decline last fall. As for Shipments, the 31-point month-over-month decline ranks as the second-largest on record next to April 2020 when the index fell a whopping 77 points. While it does not necessarily outweigh the rapid deterioration in demand, one silver lining of the report was a further huge improvement in supply chains. The reading on Vendor Lead Times was sliced in half as the index remains below pre-pandemic levels.

Again, Employment is the third input to the composite and it was the sole input to remain in expansion in May. That being said, it too fell sharply versus the prior month. While that reading indicates lower mid-Atlantic manufacturers are currently net taking on more workers, expectations saw a record decline meaning hiring plans are likely to decelerate significantly in the near future. That is as wage growth has stalled out and the length of the average workweek has been cut.

Finally, in spite of supply chain improvements and weaker demand, prices have continued to rise unabated. Prices paid hit fresh record highs across both current conditions and expectations. Prices received are off-peak but the reading did tick up slightly in May. Click here to learn more about Bespoke’s premium stock market research service.

May 13, 2022
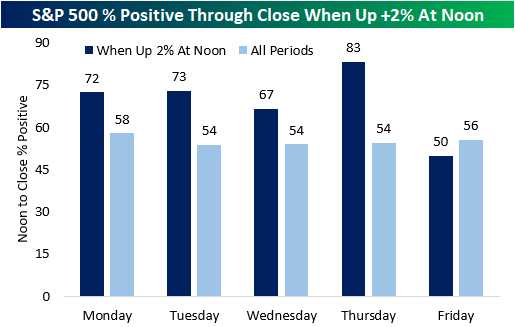
After a tumultuous week, the S&P 500 gapped higher this morning and continued to rip throughout the morning. As of noon, the S&P 500 was up 2.2%, a much-needed rally after a week of pain. Since the start of 1983, the S&P 500 has been up by 2%+ at noon 110 different times, 22 of which have occurred in the pandemic era. There has been only one occurrence this year (3/9) and two in 2021 (3/1/21 and 12/7/21). On a median basis, the S&P 500 averages a noon-to-close gain of 54 basis points (bps) when it rallies 2%+ in the morning, which is over ten times the median of all periods (5 bps). However, looking at just Friday occurrences, the S&P 500 has had a median drawdown of 9 bps from noon to the close, which is 11 bps weaker than that of all periods. Additionally, Friday was the only weekday with median noon-to-close returns below that of all periods when the index had gained at least 2% by noon.

Friday is also the only day of the week with lower than average positivity rates following 2%+ morning rallies. Thursday is the strongest with a positivity rate of 83%. Overall, the index has performed positively from noon to close 70% of the time following these occurrences. click here to become a Bespoke premium member today!