Energy Surge Relative to Industrials
Each day in our Sector Snapshot, we provide an update on each sector’s weighting within the S&P 500. Given the astounding rally in Energy stocks, the sector has gone from a record low weighting of only 1.9% in November 2020 up to a high of 4.9% last week. That is back to levels seen in the summer of 2019, and it’s also a level consistent with what we saw in the late 1990s through the first few years of the 2000s. Of course, the larger a sector’s weighting, the more impact its moves have on the broader S&P 500.
Meanwhile, another traditionally cyclical group, the Industrials, has seen its weighting steadily decline. At only 7.76%, the current reading is only about 0.3 percentage points above the pandemic low in weight which also marked a record low going back to at least 1990. Historically, Industrials have had less dramatic fluctuations in weight than Energy, but it has seen a consistent grind lower over the decades, reflecting the broader shift in the US economy from predominately goods to service-based.

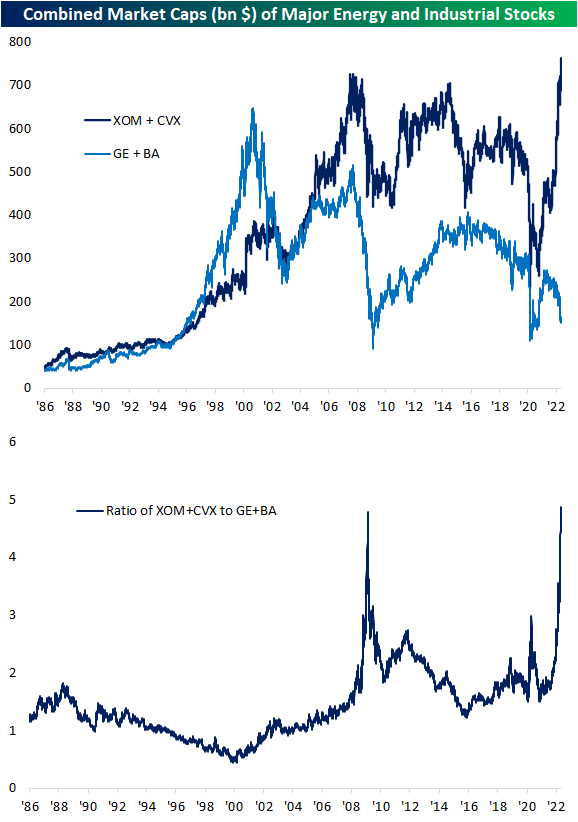
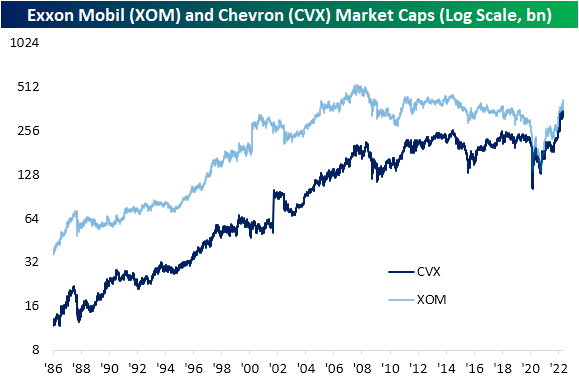
In an earlier post, we noted how two of the biggest stocks in the Energy sector by market cap, Exxon Mobil (XOM) and Chevron (CVX), have seen explosive and unprecedentedly large moves higher over the past couple of years. This is the first time these stocks have seen their market caps rise in any sort of a significant manner since the mid-2000s. As shown below, the two now account for nearly three-quarters of a trillion dollars in market cap, surpassing the previous peak in late 2007. That accounts for roughly 44% of the total size of the S&P 500 Energy sector as well.
Below we compare the combined market caps of XOM and CVX to what have historically been two of the most prominent stocks in the Industrials sector: Boeing (BA) and General Electric (GE). Right around 2000, these two stocks had a combined market cap of ~$650 billion. Over the two decades since then, these two stocks have fallen from grace with their current market caps now totaling just $163.9 billion! Relative to the market cap gains of Exxon Mobil and Chevron, the recent move has been nothing short of exponential as shown in the second chart below. The only comparable period was in 2009 when both groups fell, but the Industrial names were hit much harder.
As we discussed in regards to Tech stocks now versus the Dot Com Peak in March of 2000 in last week’s Bespoke Report (pages 20 & 21), the big declines in the size of GE and BA as XOM and CVX rocket higher are yet more examples of the ebb and flow of market leadership. Click here to learn more about Bespoke’s premium stock market research service.