Aug 9, 2022
Tomorrow, the all-too-important July CPI report comes out. Although the FOMC tends to focus more weight on personal consumption expenditures (PCE) instead of CPI, this release will give investors the first official inflation read of July. Depending on how this report comes in relative to expectations will therefore give a lot of insight into the direction/intensity of policy heading into the last four months of the year. A higher print (especially given the strength in last week’s nonfarm payroll data) would a higher likelihood for continued aggressiveness in rate hikes, while a weaker than expected print could cause markets to price in a more benign path moving forward. As of today, analysts expect headline CPI to increase 8.7% y/y, which would be a 0.4% decline from June’s rate.
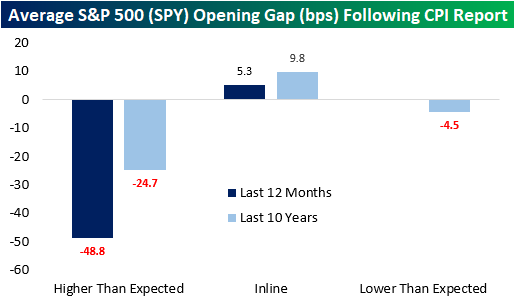
Last month, analysts expected CPI to rise 8.8% YoY, but the print came in at 9.1%. Over the last twelve months, CPI has come in hotter than expected two-thirds of the time. Notably, CPI has not come in below expectations over the last twelve months but did match expectations one-third of the time. In terms of market expectations, over the last twelve months, the S&P 500 has averaged an opening gap of -49 basis points following a CPI print that was hotter than expected. That’s about twice the average gap lower of 25 bps following all higher-than-expected prints over the last ten years. The market tends to gap higher following an inline print, averaging a gain of 5.3 bps over the last twelve months and 9.8 bps over the last ten years. Click here to learn more about Bespoke’s premium stock market research service.
Following all CPI prints over the last twelve months, the S&P 500 has tended to gap lower but move close to the break-even level in the first half hour of trading. Following this initial bounce, the S&P 00 has tended to bounce around but remain in negative territory. The second half of the trading day has been much weaker, though, finishing the day down 60 basis points on the day.

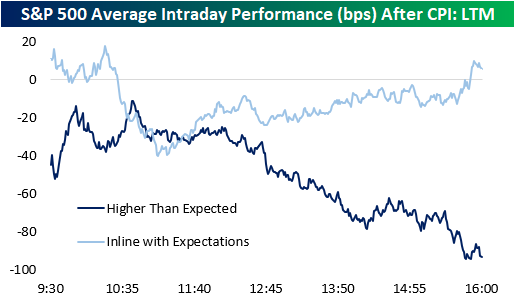
Over the last twelve months, intraday performance has diverged based on the result of the report. When CPI matches expectations (three occurrences), the S&P 500 gaps higher but has surrendered those gains by about 10:30. However, following a bottom at about 11:00, stocks tend to pick up steam throughout the rest of the trading day. When CPI comes in hotter than expected, we see nearly the exact opposite. The S&P 500 gaps lower, but generally moves higher until about 10:45, when things take a turn weaker. The back half of the trading day has been notably weaker with stocks closing right near their lows of the day, booking an average decline of 93 basis points. Click here to learn more about Bespoke’s premium stock market research service.
Aug 1, 2022
In 2022, extremely elevated gas prices have been impacting the economy, as every product-producing company has seen energy and transportation costs increase, forcing price hikes on the part of businesses simply to keep margins flat. Although there are a variety of factors affecting CPI readings, high gas prices certainly apply upward pressure. Today, gas prices are still extremely elevated compared to historical levels. At the AAA current national average of $4.22, just 1.8% of all days since the start of 2005 have seen a higher national average high, and all of them occurred this year. Click here to learn more about Bespoke’s premium stock market research service.

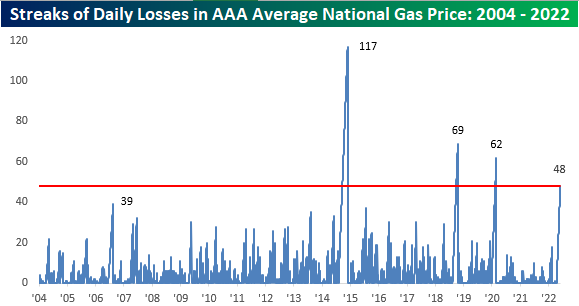
The national average price per barrel is still up 32.75% y/y, but this is actually the smallest y/y increase so far in 2022 and comes as the national average price has declined for 48 consecutive days. That’s the fourth longest streak on record. This streak is certainly notable, but gas prices are still at a level that is wearing on consumers.

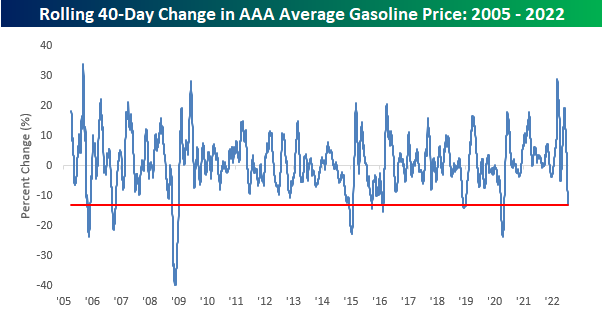
The 40-day rate of change in average gas prices (-15%) has been notable as well, with only six other periods seeing a larger decline on a percentage basis. The most recent occurred during the COVID crash when it became clear that demand was going to deteriorate due to government-imposed mandates across the globe. Consumers will hope for further declines as we begin to near the $4.00 per gallon level. Not only have prices been falling lately, but they have also been more volatile than usual, as the current 50-day standard deviation (26 cents) is 3.2 times higher than the average since 2005. Click here to learn more about Bespoke’s premium stock market research service.

Jul 25, 2022
The price of a gallon of gas, while still up YTD and relative to most other periods in the past, has pulled back considerably and consistently over the last six weeks. While a gallon of gas topped $5 in early to mid-June, over the weekend, the average price was back down to $4.36. The decline in prices has also been consistent as prices have now declined for 41 straight days. Going back to 2005, when AAA began tracking the daily national average price, this current streak now ranks as the fourth-longest on record after surpassing the 39-day streak from September 2006 over the weekend. In order for this current streak to move into the top three and oust the 62-day streak from the COVID crash, we’ll need to see another three weeks of daily declines, and in order to move into first place overall, we’d need to see the current streak nearly triple in length to 118 days and stretch out to early October!

While the current streak of declines is the fourth-longest on record, the magnitude of gasoline’s decline over the last 40 days hasn’t been quite as extreme. At -13%, there have been seven other periods where average prices at the pump experienced a larger decline over the same time period. What is notable, however, is that back in March the 40-day rate of change was the second highest on record trailing only the 33% increase that came in the wake of Hurricane Katrina in September 2005.
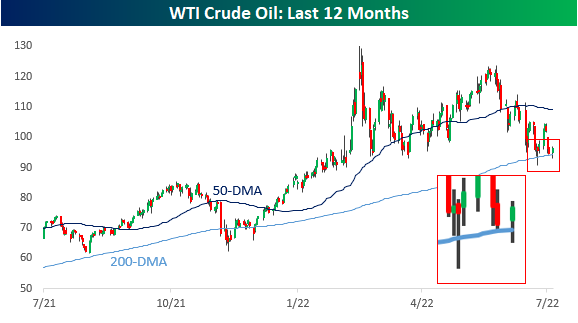
In order for prices at the pump to keep declining, we’re going to need oil prices either to stay around current levels or continue declining. Oil prices have obviously been weak for the last month or so, but over the last two weeks have shown some stabilization above the 200-DMA, including two different days when the price dropped below the 200-DMA intraday but bounced. If the 200-DMA holds in the near-term, gas prices are likely to stop declining, so this will be a key level to watch for what will ultimately determine the health of the consumer. Click here to learn more about Bespoke’s premium stock market research service.
Apr 12, 2022
Log-in here if you’re a member with access to the Closer.
Looking for deeper insight into markets? In tonight’s Closer sent to Bespoke Institutional clients, we begin tonight with a look at market pricing for policy rates before diving into today’s update of CPI data and some reasons to believe inflation has peaked. We then update the latest data on government receipts and outlays. We round out tonight’s note with a recap of the historically bad reopening of 10 year notes.
If you’re wondering what the Closer is like each day, click here or on the thumbnail image below for a sample of a few pages from the report.

See today’s full post-market Closer and everything else Bespoke publishes by starting a 14-day trial to Bespoke Institutional today!
Apr 12, 2022
See what’s driving market performance around the world in today’s Morning Lineup. Bespoke’s Morning Lineup is the best way to start your trading day. Read it now by starting a two-week trial to Bespoke Premium. CLICK HERE to learn more and start your trial.
“In spite of the cost of living, it’s still popular.” – Kathleen Norris
The CPI report that everyone was waiting for has finally arrived and as is usually the case when everyone expects the worst, the results weren’t as bad as feared (although they’re far from good). On a headline basis, CPI rose 1.2% m/m which was right in line with forecasts. Core CPI, however, rose ‘just 0.3%’ compared to forecasts for a gain of 0.5%. Given the weaker than expected core reading, futures have shot higher with the Nasdaq up nearly 1%. As equities have rallied, Treasury yields are falling but still high even relative to where they were last week!
Make no mistake, these readings are still very high relative to recent history. For example, backing out the period since 2020, the 0.3% increase in m/m Core CPI would have been the highest since March 2006. Compared to recent trends and what people were expecting, though, this morning’s report was a positive surprise.
Read today’s Morning Lineup for a recap of all the major market news and events from around the world, including the latest US and international COVID trends.
We all know that recent inflation data has been high, but the consistency of upward pressure has been incredible. It’s a popular narrative that the Fed is behind the curve, but they’re not the only ones. Economists have simply not been able to catch up and get ahead of the persistent trend of rising prices. The chart below shows the rolling 24-month total of the weaker than expected m/m headline CPI reports going back to 2000.
During this span there have only been three months where headline CPI came in weaker than expected. Three!. Going back to 2000, there has never been a period where weaker than expected CPI reports were as scarce as they have been in the last two years.

Start a two-week trial to Bespoke Premium to read today’s full Morning Lineup.