May 19, 2022
Growth stocks outperformed value stocks by a wide margin in the years leading up to the pandemic. Growth also outperformed value in the first ~18 months after the pandemic, but that trend has been flipped on its head since late 2021. You can see the recent convergence between growth and value in the chart below. Entering 2022, the S&P 500 Growth index was outperforming the S&P 500 Value index by ~40 percentage points since the pre-COVID high for the stock market in February 2020. Now, Growth is only outperforming Value by ~8 percentage points.

The shift from growth to value has been even more dramatic in the more economically sensitive small-cap space. Remarkably, the Russell 2,000 Growth index is now DOWN 6% on a total return basis since the pre-COVID peak for stocks on 2/19/20. Six months ago, this index was still up 45% from its pre-COVID high.
Fed Chair Powell first shifted to a tighter monetary stance in November 2021. In just six months since Powell’s pivot, we’ve seen the entire post-COVID bull market for small-caps give up its gains and then some. And this doesn’t even factor in a double-digit percentage point increase in inflation since COVID began that pushes “real” returns for the Russell 2,000 Growth index much deeper into negative territory. Click here to learn more about Bespoke’s premium stock market research service.

May 19, 2022
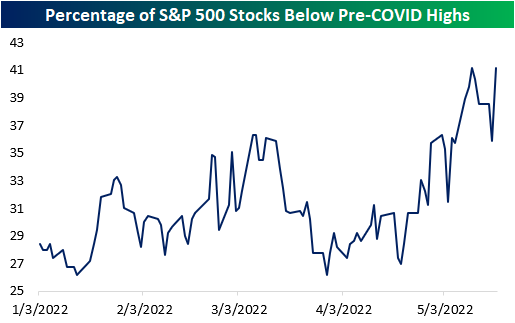
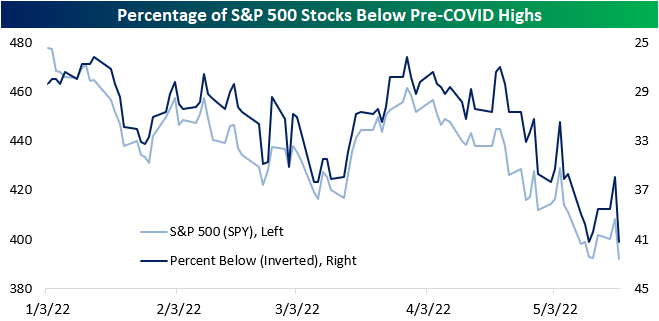
Last week, we outlined the percentage of stocks in each S&P 500 sector that had fallen below their pre-COVID highs to show that many of the stocks that surged due to pandemic effects have significantly fallen off, netting long-term holders a negative return since the onslaught of the pandemic. (Read it here.) Yesterday, the S&P 500 fell by over four percent to set a new 52 week low, breaking the 4,000 level. The index is still up over 15% relative to its pre-COVID high, but as of yesterday’s close, 41.2% of S&P 500 members were below their respective pre-COVID highs, as 26 members crossed below this critical level yesterday.
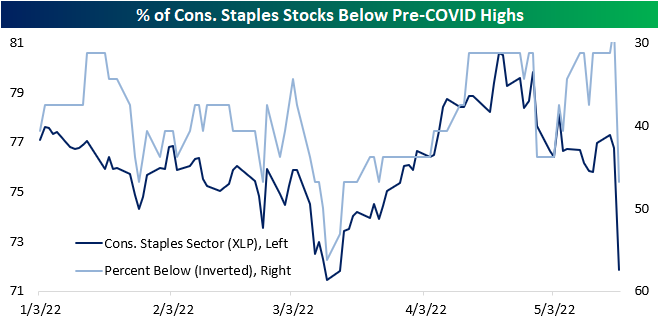
Notably, six of the 32 S&P 500 consumer staples stocks crossed below, moving the percentage from 28.1% to 46.9% on the back of weak earnings reports from Walmart (WMT) and Target (TGT). 66.7% of Communication Services stocks and 60.0% of Real Estate stocks in the S&P 500 are below their pre-COVID highs, but only 18.5% and 23.8% of Materials and Energy stocks are below this level, respectively. Additionally, 8.2% of S&P 500 members were within 5% of their pre-COVID highs, and 15.1% are within 10%.
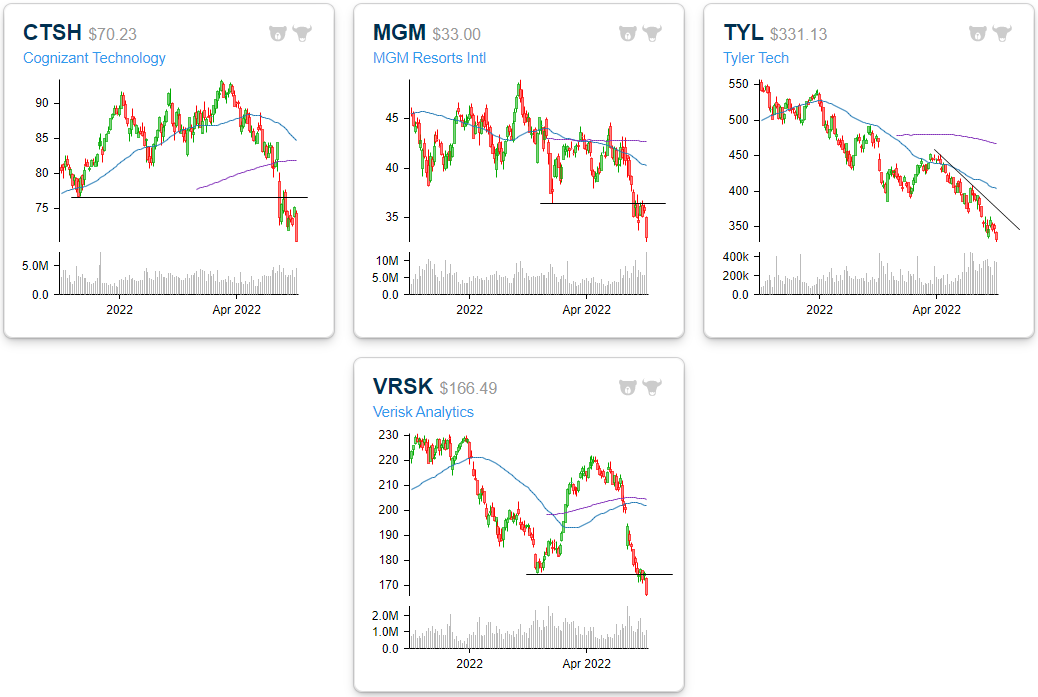
Four S&P 500 stocks crossed below this critical level for the first time in a while yesterday: Cognizant Technology (CTSH), MGM Resorts (MGM), Tyler Tech (TYL) and Verisk Analytics (VRSK). This comes amidst weakness in the Technology sector (XLK) versus the broader S&P 500, as the sector is down close to 25% on a YTD basis versus the S&P 500’s drawdown of about 18%. However, XLK is still up close to 30% relative to pre-COVID highs.
Additionally, there are three stocks that entered a 2% channel above their pre-COVID highs for the first time in a while. Dexcom (DXCM) entered the channel amidst weakness in the broader energy space, and Pentair (PNR) extended the downtrend that is yet to break. Walmart (WMT) sold off significantly in two consecutive days after a weak earnings report and is now less than 1% from its pre-COVID high. A month ago WMT was 30% above this level. Click here to become a Bespoke premium member today!

Apr 29, 2022
Amazon (AMZN) was one of the primary beneficiaries of the pandemic as consumers were forced to engage in commerce digitally and corporations became increasingly willing to migrate to the cloud. In the first year or so after the March 2020 COVID Crash, AMZN shares soared from $2,000 up to $3,700. Since peaking in mid-2021, however, it has been a different story. Since AMZN reported earnings last night, shares have fallen another 15%. This leaves AMZN up just 13.5% from the level it was trading at right before the pandemic began on 2/19/20.
Although the stock is now barely higher versus pre-COVID levels, revenues continue to climb. Relative to pre-pandemic levels, trailing 12-month revenues have increased by 70.3% (CAGR of 27.2%). As implied, the price to sales multiple has compressed considerably relative to pre-pandemic levels. At the highs, AMZN was trading 3.8 times sales. The highest P/S multiple for the stock since the start of 2020 occurred in September of 2020, when the multiple hit 5.5. As it currently stands, the price to sales multiple is at new lows relative to the start of 2020 at just 2.7.

While AMZN revenues are up 70% from pre-COVID levels, margins have compressed considerably. In Q1 2020, AMZN posted operating margins of 9.5%. In Q1 2022, AMZN reported operating margins of 3.2%. These results can be attributed to inflationary pressures, labor challenges, supply chain constraints and foreign exchange headwinds. As you can see in the chart below, margin compression has hampered EPS, resulting in a decline in trailing 12-month EPS over the last three quarters. Relative to pre-pandemic levels, EPS have risen by 52.5% (CAGR: 21.1%), but they’ve declined by 38.8% over the last three quarters. Click here to become a Bespoke Institutional subscriber and gain access to our Conference Call Recaps.
