Weak May Housing Data
Earlier this week, we highlighted the fact that mortgage activity had fallen off a cliff due to a historic rise in rates. This is an important factor to keep in mind as the housing market tends to be a strong leading indicator for recessions, as every recession besides the COVID crash since the early 1960s has been preceded by a pronounced decline in Housing Starts. Although the NAHB index has already rolled over substantially, Housing Starts and Building Permits are yet to drop on a trailing twelve-month basis. However, the data has been showing signs of weakness, as we have now seen two consecutive months of declines in permits and a significant month-over-month fall in starts.
The table below breaks down this month’s report by type of unit and region and shows both the month-over-month and year-over-year changes. Contrary to what we saw last month, Housing Starts moved higher in the Northeast and Midwest on a m/m basis, while the South and West saw dramatic declines. On a y/y basis, only the Northeast (smallest of the four regions) saw starts move higher. In aggregate, Housing Starts fell by 14.4% month over month and 3.5% year over year. Although multi-units fell more than single units, the decline was substantial for both. In terms of permits, there was no positivity in sight, as every region saw m/m declines. This is not a positive sign for future starts data, as permits must be issued before starts can occur. In aggregate, Building Permits fell by 7.0% month over month, driven by a massive decline in the Northeast.

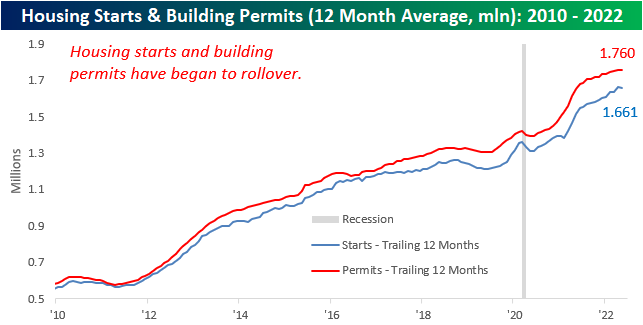
For the first time since February of 2021, the 12-month average of Housing Starts declined on a m/m basis. A rollover in this figure tends to be a strong recession indicator, which based on prior history would suggest that the economy is not yet in a recession. If this data continues to weaken, though. recession alarms will start ringing.

The charts below show the rolling 12-month average for Housing Starts and Building Permits since 2010 on both an overall basis (top chart) and for single-family units specifically (bottom chart). Overall, the 12-month average for headline starts and permits has experienced headwinds as of late with the rate of increase for both slowing down and starts actually showing a slight decline. The trend for single-family units, however, is much more divergent as permits have already started to roll over after peaking last summer while single-family starts have essentially leveled off during that same span. . Click here to become a Bespoke premium member today!