Aug 12, 2022
We like to use credit default swaps (a product that pays out investors if a reference company defaults) to track risk premiums in the corporate bond market. When risk premiums rise, credit default swaps get more expensive, and the spread implied between risk free rates and CDS rises. Click here to learn more about Bespoke’s premium stock market research service.
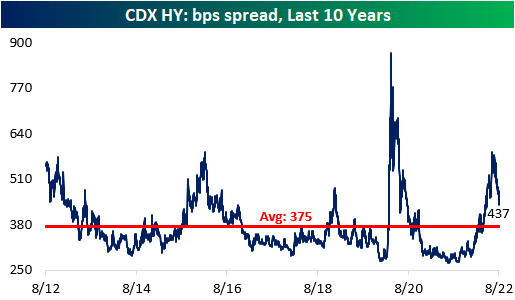
As recession fears intensified throughout the first half of 2022, both the investment grade and high yield credit default swap indices skyrocketed, gaining 106.7% and 110.5% between the start of the year and the highs, respectively. However, earnings were not as bad as feared, economic data is starting to come in better than expected, gas prices have fallen, and CPI seems to have peaked in June. All of this has caused substantial declines in CDS index spreads, with the risk premium associated with each falling by about a quarter since their summer peak.


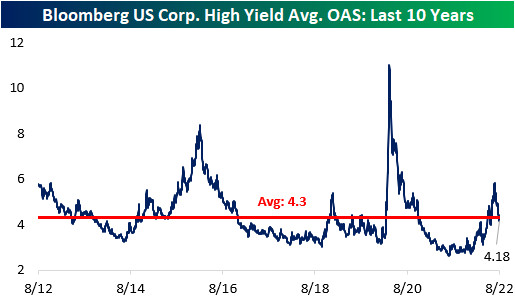
Although CDX High Yield’s spread is well off of its highs, it is still above the average over the last ten years, implying a still elevated risk related to recession and potential defaults. We can also tie CDS indices to the performance of actual corporate bonds. The option-adjusted spread (a proxy for the credit risk over risk-free rates for a given investment) for high yield bonds in the “cash” market has a 0.88 correlation to CDS over the past decade. Notably, the CDX HY spread remains above its long-term average, while that High Yield Average OAS is below its average, implying investors may be getting under-compensated for the risk they are taking in the high yield debt market. Click here to learn more about Bespoke’s premium stock market research service.
Jun 15, 2022
As mentioned in our piece from earlier today, gold did not necessarily deliver superior performance during the last QT cycle. This leaves investors to ponder: which asset classes did deliver substantial returns? Is there anywhere to hide? Although the macroenvironment is vastly different this time around, it is still helpful to look at past occurrences to attempt to put a frame of reference around today’s markets. Major differences include rampant inflation (particularly in commodities), supply chain constraints, lapping stimulus benefits, and weakening economic data. Below, we summarize the performance of the S&P 500, bonds, agricultural commodities, and oil during previous QT cycles.
The S&P 500 outperformed Gold during the last QT cycle, gaining 19.2%, which constitutes an annualized return of 10.1%. The graph below outlines the performance of the S&P 500 ETF (SPY) during different cycles of QE and QT. As you can see, equities were not particularly steady during the last QT cycle, but SPY gained significantly after the Fed announced its intent to slow the balance sheet winddown.

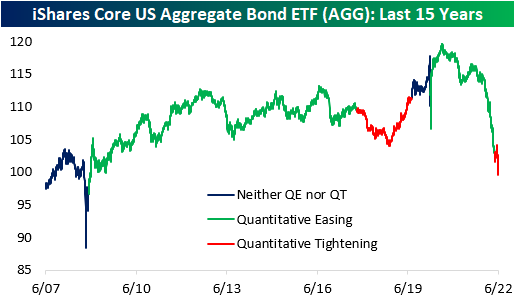
In the last QT cycle, the bond market initially sold off but managed to finish higher for the entire period. The iShares Core US Aggregate Bond ETF (AGG) bottomed at a drawdown of 4.7% about a year after the cycle began but proceeded to gain 6.7% through the final 203 trading days of the cycle. When all was said and done, AGG finished the cycle with gains of 1.7%. Similar to what we saw in gold, much of the gains were seen after the Fed announced its plan to slow the wind-down of the balance sheet. This suggests that rates rose at first but then reversed course when the Fed announced the impending end of QT. So far in the current cycle, AGG has already dropped by 2.7%, but bonds sold off hard in anticipation of QT in late 2021 and early 2022. On a YTD basis, the ETF is down a whopping 12.7%.
Agricultural commodities performed poorly during the last QT cycle, dropping 15.7%. This constitutes an annualized return of -8.9%, but the broader agricultural space was in a downtrend before QT began. Currently, agricultural commodities are in an uptrend, so it will be interesting to watch the price action as QT ramps up. On a YTD basis, the Invesco DB Agriculture Fund (DBA) is up 10.2% and is essentially flat since QT began in early May.

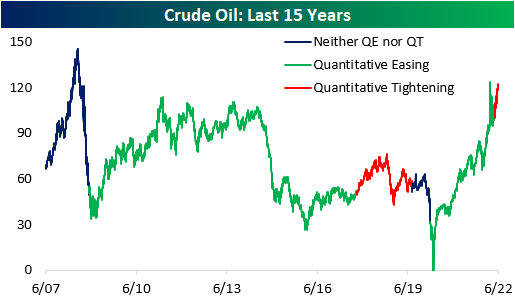
During the last QT cycle, crude oil gained 15.8%, but it would be difficult to attribute these gains to quantitative tightening. Since the Fed began tightening this year, crude oil has jumped 16.0% higher. In the last cycle, oil rallied higher before subsequently crashing, which would certainly be welcomed by many in this cycle. Click here to become a Bespoke premium member today!
Jun 1, 2022
Log-in here if you’re a member with access to the Closer.
Looking for deeper insight into markets? In tonight’s Closer sent to Bespoke Institutional clients, we start out tonight by looking at the performance of momentum relative to value as well as how earnings estimates have changed (page 1). We then pivot over to a look at the technicals of high yield and investment-grade bond ETFs. We zero in on the record streak below the 50-DMA for investment grade and what previous streaks have meant for performance (pages 2 and 3). We then quantify the Beige Book findings (page 4), update job openings data (pages 5 and 6), before closing out with an update of manufacturing PMIs (page 7).

See today’s full post-market Closer and everything else Bespoke publishes by starting a 14-day trial to Bespoke Institutional today!
Jun 1, 2022
Searching for ways to better understand the fixed income space or looking for actionable ideas in this asset class? Bespoke’s Fixed Income Weekly provides an update on rates and credit every Wednesday. We start off with a fresh piece of analysis driven by what’s in the headlines or driving the market in a given week. We then provide charts of how US Treasury futures and rates are trading, before moving on to a summary of recent fixed income ETF performance, short-term interest rates including money market funds, and a trade idea. We summarize changes and recent developments for a variety of yield curves (UST, bund, Eurodollar, US breakeven inflation and Bespoke’s Global Yield Curve) before finishing with a review of recent UST yield curve changes, spread changes for major credit products and international bonds, and 1 year return profiles for a cross section of the fixed income world.
In this week’s report we discuss the worst bond market in history through May.

Our Fixed Income Weekly helps investors stay on top of fixed income markets and gain new perspective on the developments in interest rates. You can sign up for a Bespoke research trial below to see this week’s report and everything else Bespoke publishes free for the next two weeks!
Click here and start a 14-day free trial to Bespoke Institutional to see our newest Fixed Income Weekly now!
Apr 13, 2022
Searching for ways to better understand the fixed income space or looking for actionable ideas in this asset class? Bespoke’s Fixed Income Weekly provides an update on rates and credit every Wednesday. We start off with a fresh piece of analysis driven by what’s in the headlines or driving the market in a given week. We then provide charts of how US Treasury futures and rates are trading, before moving on to a summary of recent fixed income ETF performance, short-term interest rates including money market funds, and a trade idea. We summarize changes and recent developments for a variety of yield curves (UST, bund, Eurodollar, US breakeven inflation and Bespoke’s Global Yield Curve) before finishing with a review of recent UST yield curve changes, spread changes for major credit products and international bonds, and 1 year return profiles for a cross section of the fixed income world.
In this week’s report we highlight a fixed income investment that has performed beautifully amid extremely high inflation.

Our Fixed Income Weekly helps investors stay on top of fixed income markets and gain new perspective on the developments in interest rates. You can sign up for a Bespoke research trial below to see this week’s report and everything else Bespoke publishes free for the next two weeks!
Click here and start a 14-day free trial to Bespoke Institutional to see our newest Fixed Income Weekly now!