Biggest Decliners Since 6/7
There’s been no hiding from pain in equity markets since last Tuesday (June 7th). As mentioned in our Morning Lineup today, the S&P 500 is on pace to decline by 1%+ on four consecutive days, and if we hold onto these levels through the close, the index will have dropped over 2% for three consecutive days. This period of weakness comes on the back of another hotter than expected CPI print, continued disruption from the war in Ukraine, and a 10-year yield healthily above 3%. As of midday, the Russell 3000 was down 9.5% since the close on 6/7 and 22% YTD.
As is the case for every pullback, long-term investors should look for beaten-down names with solid growth runways. The first step of this process is to recognize which names have pulled back the most and then begin looking for diamonds in the rough. The table below shows the 18 Russell 3000 members who are down more than 25% since 6/7 with a market cap of at least $1 billion. For the entire Russell 3000, the average stock in the index is down 24.4% YTD (median: -24.3%) and 10.44% since 6/7 (median: -9.86%). Narrowing that field down to stocks with market caps of at least $1 billion, the average stock is down 17.4% on a YTD basis (median: -20.5%) and has traded down by 10.3% since 6/7 (median: -9.8%).
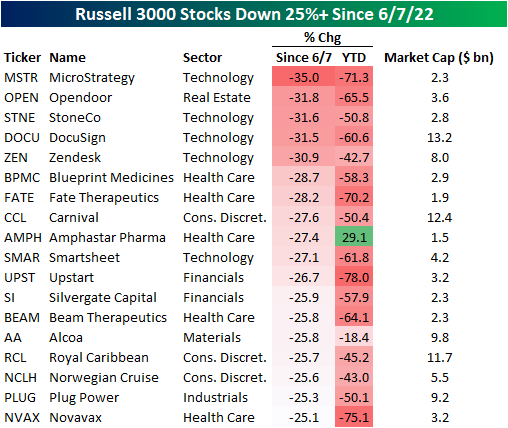
The exposures of these 18 stocks are quite mixed, as the list includes both pandemic darlings (i.e. Opendoor- OPEN, DocuSign- DOCU) and some of the biggest pandemic era decliners (i.e. Carnival- CCL) and Royal Caribbean-RCL). On a median basis, these stocks trade 4.5 times sales and are expected to see revenue increase by 38.6% over the next twelve months. Of these 18 names, Beam Therapeutics (BEAM) is expected to see the largest sales decline (-38.7%) and Norwegian Cruise (NCLH) is expected to see the largest increase (449.8%). Relative to sales, BEAM is the most expensive at 37.4 times LTM sales and OPEN is the cheapest at 0.3X.
Individual stock performance since 6/7 does appears little correlated to YTD performance. As shown, only 8.1% of the variation in the percent change since 6/7 can be explained by YTD performance. Click here to become a Bespoke premium member today!
