Jul 6, 2022
Investors often turn to Gold as a safe asset in tumultuous times, as the asset tends to hold its value during market downturns. For example, when the S&P 500 sold off by 34.1% during the COVID Crash, the SPDR Gold Trust (GLD) declined just 3.6%. In 2022, GLD initially acted as a strong hedge to the equity market, gaining 1.0% on a YTD basis on June 16th as SPY entered bear market territory. However, GLD topped out in early March and is now trading 14.0% off of its closing 2022 high. GLD has even underperformed SPY since March 8th, declining 14.0% versus SPY’s drop of 8.2%. Click here to learn more about Bespoke’s premium stock market research service.
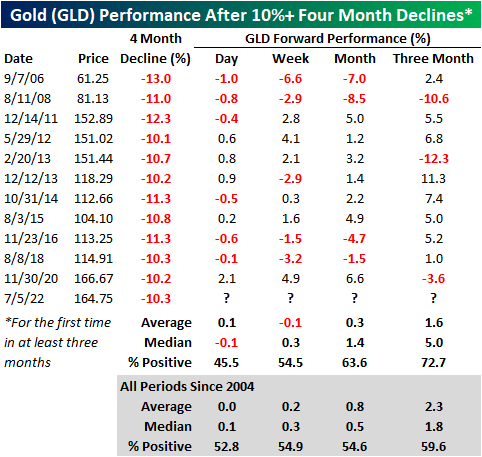
Over the last four months, GLD has declined by 10.3%, which is elevated for a relatively stable asset during a bear market. Since its inception in 2004, GLD has declined 10% or more over a four-month period (with no occurrences in the prior three months) twelve times with each occurrence shown in the chart below.

The forward performance following four-month declines of 10%+ has been mixed depending on the time frame. The next day (which would be today), GLD has booked a median loss of 10 basis points, gaining just 45.5% of the time. However, the median return and positivity rate in the next week is inline with historical averages. Over the one and three months, performance tends to pick back up, registering gains 63.6% and 72.7% of the time, respectively. Over the next three months, GLD has had a median gain of 5.0%, which is more than two and a half times the median of all periods. Click here to learn more about Bespoke’s premium stock market research service.
Jun 30, 2022
Whether you’re looking at monthly, quarterly, or first-half performance, this year’s S&P 500 performance has been quite weak. As investors, we must avoid falling into the sunken-cost fallacy and are forced to be forward-looking.
Starting with weak months, there have been a total of 83 months in the post-WWII era in which the S&P 500 declined at least 5%. In fact, this has occurred three times in 2022 alone, and if the current pace continues will top the post-WWII high in 2008 when there were five months of 5%+ declines. Click here to learn more about Bespoke’s premium stock market research service.

In addition to 5%+ monthly declines, we also looked at periods where the S&P 500 declined 10%+, as well as six-month periods when the S&P 500 fell 20%+ (with no prior occurrences in the last three months). Over the following day, performance was inline with the historical average following 5%+ monthly declines and 10%+ quarterly declines, but the first trading day following a six-month decline of 20%+ was much better than the historical average. Over the following week and month, though, the picture looks different as performance after 10%+ quarterly declines has been much better than average while performance following 20%+ six-month declines has been well below average. In terms of the week and month after 5%+ monthly declines, returns have pretty much been in line with the historical average.

Taking a look at positivity rates (percent of the time the S&P 500 has posted gains in a respective period), the S&P 500 has boasted above average rates following a monthly decline of 5%+ in both the next day and month, but rates are lower over the following week. After quarterly declines of 10%+, positivity rates were lower in the following day, but above average for the following week and month, coming in at 61.9% and 71.4%, respectively. On the downside, positivity rates were much lower following the first rolling six month decline of 20%+ in the next week and month, coming in at 40.0% for both. Investors should note that the first occurrence of a 20%+ rolling six month decline occurred on June 16th. Click here to learn more about Bespoke’s premium stock market research service.

Jun 13, 2022
There’s been no hiding from pain in equity markets since last Tuesday (June 7th). As mentioned in our Morning Lineup today, the S&P 500 is on pace to decline by 1%+ on four consecutive days, and if we hold onto these levels through the close, the index will have dropped over 2% for three consecutive days. This period of weakness comes on the back of another hotter than expected CPI print, continued disruption from the war in Ukraine, and a 10-year yield healthily above 3%. As of midday, the Russell 3000 was down 9.5% since the close on 6/7 and 22% YTD.
As is the case for every pullback, long-term investors should look for beaten-down names with solid growth runways. The first step of this process is to recognize which names have pulled back the most and then begin looking for diamonds in the rough. The table below shows the 18 Russell 3000 members who are down more than 25% since 6/7 with a market cap of at least $1 billion. For the entire Russell 3000, the average stock in the index is down 24.4% YTD (median: -24.3%) and 10.44% since 6/7 (median: -9.86%). Narrowing that field down to stocks with market caps of at least $1 billion, the average stock is down 17.4% on a YTD basis (median: -20.5%) and has traded down by 10.3% since 6/7 (median: -9.8%).
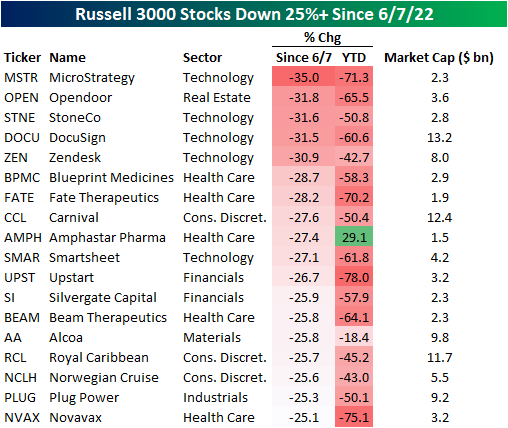
The exposures of these 18 stocks are quite mixed, as the list includes both pandemic darlings (i.e. Opendoor- OPEN, DocuSign- DOCU) and some of the biggest pandemic era decliners (i.e. Carnival- CCL) and Royal Caribbean-RCL). On a median basis, these stocks trade 4.5 times sales and are expected to see revenue increase by 38.6% over the next twelve months. Of these 18 names, Beam Therapeutics (BEAM) is expected to see the largest sales decline (-38.7%) and Norwegian Cruise (NCLH) is expected to see the largest increase (449.8%). Relative to sales, BEAM is the most expensive at 37.4 times LTM sales and OPEN is the cheapest at 0.3X.
Individual stock performance since 6/7 does appears little correlated to YTD performance. As shown, only 8.1% of the variation in the percent change since 6/7 can be explained by YTD performance. Click here to become a Bespoke premium member today!

Jun 13, 2022
See what’s driving market performance around the world in today’s Morning Lineup. Bespoke’s Morning Lineup is the best way to start your trading day. Read it now by starting a two-week trial to Bespoke Premium. CLICK HERE to learn more and start your trial.
“Come what may, all bad fortune is to be conquered by endurance.” – Virgil

Below is a snippet of content from today’s Morning Lineup for Bespoke Premium members. Start a two-week trial to Bespoke Premium now to access the full report.
It’s not a pretty picture for risk assets of any kind this morning as equity indices around the world are down over 2%, US futures are down by about the same amount, treasuries are selling off hard, and crypto prices are down sharply. Concerns over inflation and its impact on economic growth have become heightened over the last several days, and unlike prior periods in recent history where growth has come into question, with inflation pressures as strong as they are, there is little optimism that the Fed can help to cushion the blow.
In today’s Morning Lineup, there’s a lot covered this morning as we discuss prior streaks of 1%+ and 2%+ declines for the market (pg 4), the plunge in crypto prices (pg 5), overnight movements in the yen (pg 6), action in Asian and European markets (pg 6), overnight economic data in Asia and Europe (pg 7), and much more.
The first trading day of the week has already been weak for the market, but today’s 2%+ downside gap in SPY will be, by far, the largest downside gap to start a week of the year and the largest since March 2020.

Start a two-week trial to Bespoke Premium to read today’s full Morning Lineup.