Jun 15, 2022
As mentioned in our piece from earlier today, gold did not necessarily deliver superior performance during the last QT cycle. This leaves investors to ponder: which asset classes did deliver substantial returns? Is there anywhere to hide? Although the macroenvironment is vastly different this time around, it is still helpful to look at past occurrences to attempt to put a frame of reference around today’s markets. Major differences include rampant inflation (particularly in commodities), supply chain constraints, lapping stimulus benefits, and weakening economic data. Below, we summarize the performance of the S&P 500, bonds, agricultural commodities, and oil during previous QT cycles.
The S&P 500 outperformed Gold during the last QT cycle, gaining 19.2%, which constitutes an annualized return of 10.1%. The graph below outlines the performance of the S&P 500 ETF (SPY) during different cycles of QE and QT. As you can see, equities were not particularly steady during the last QT cycle, but SPY gained significantly after the Fed announced its intent to slow the balance sheet winddown.

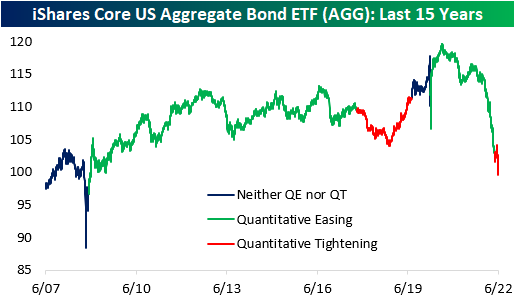
In the last QT cycle, the bond market initially sold off but managed to finish higher for the entire period. The iShares Core US Aggregate Bond ETF (AGG) bottomed at a drawdown of 4.7% about a year after the cycle began but proceeded to gain 6.7% through the final 203 trading days of the cycle. When all was said and done, AGG finished the cycle with gains of 1.7%. Similar to what we saw in gold, much of the gains were seen after the Fed announced its plan to slow the wind-down of the balance sheet. This suggests that rates rose at first but then reversed course when the Fed announced the impending end of QT. So far in the current cycle, AGG has already dropped by 2.7%, but bonds sold off hard in anticipation of QT in late 2021 and early 2022. On a YTD basis, the ETF is down a whopping 12.7%.

Agricultural commodities performed poorly during the last QT cycle, dropping 15.7%. This constitutes an annualized return of -8.9%, but the broader agricultural space was in a downtrend before QT began. Currently, agricultural commodities are in an uptrend, so it will be interesting to watch the price action as QT ramps up. On a YTD basis, the Invesco DB Agriculture Fund (DBA) is up 10.2% and is essentially flat since QT began in early May.

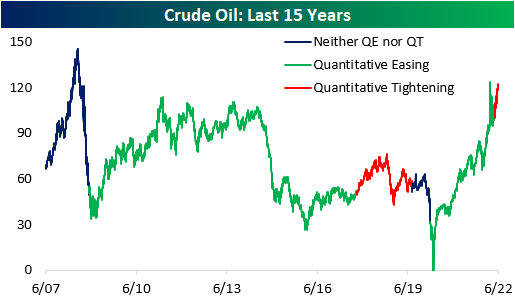
During the last QT cycle, crude oil gained 15.8%, but it would be difficult to attribute these gains to quantitative tightening. Since the Fed began tightening this year, crude oil has jumped 16.0% higher. In the last cycle, oil rallied higher before subsequently crashing, which would certainly be welcomed by many in this cycle. Click here to become a Bespoke premium member today!

Jun 15, 2022
Quantitative tightening (QT) has wide-spanning effects on the economy, as it puts upward pressure on risk-free interest rates due to increased supply in debt markets (assuming all else equal). The Fed announced its QT strategy just one meeting (5/3/22) after hiking its target rates for the first time since 2018 back in March. The previous QT cycle in 2017 did not begin until about two years after the Fed first started hiking rates. The reason for the quick turnaround this time around, though, stems from the fact that inflation has been running rampant, and the balance sheets of consumers and corporates are in relatively strong positions.
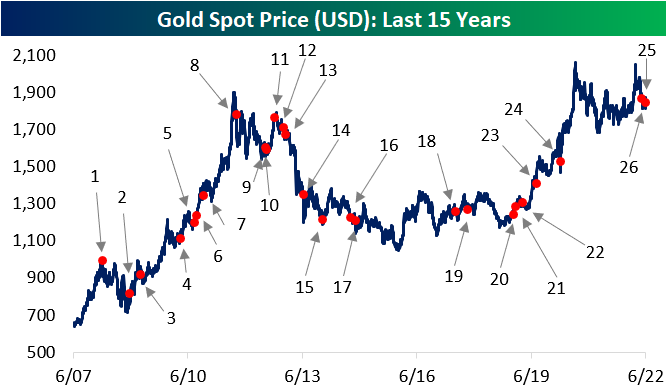
In terms of how various asset classes may perform in the current period of QT, some investors have looked back to the prior period of QT for insight. As mentioned above, there are some important distinctions between the current period and the last period of QT, so it may not be an apples-to-apples comparison, but there are certainly some similarities that can make knowing what happened back then helpful. Using the price of gold over the last 15 years as a backdrop, the chart below shows key events related to periods of quantitative easing (QE) and QT. The event surrounding each dot is summarized in the table below. Click here to learn more about Bespoke’s premium stock market research service.


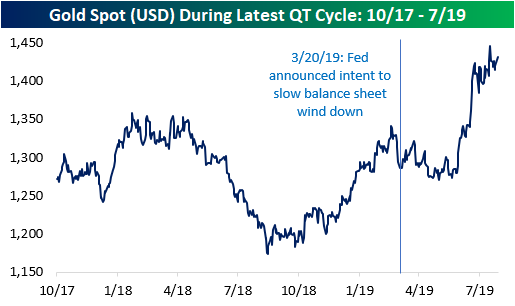
Between October 2017 and July 2019 (the last QT cycle), the price of gold rose by 12.6%, which works out to an annualized return of 6.5%. Over the last 15 years, the price of gold has held an annualized return rate of 6.8%, so there was no clear differentiation in the performance of gold during that period of QT and the last 15 years as a whole. Looking at the chart, though, much of the gains from the last cycle of QT came late in that cycle as the Fed had already announced its intent to end the running off of assets from its balance sheet. In fact, the S&P 500 outperformed gold by more than six percentage points during the last QT cycle. In fact, before the March 2019 announcement that the Fed would wind down its balance sheet, gold was practically unchanged relative to the start of the QT cycle. Click here to become a Bespoke premium member today!

Apr 6, 2022
Log-in here if you’re a member with access to the Closer.
Looking for deeper insight into markets? In tonight’s Closer sent to Bespoke Institutional clients, we begin with a summary of the minutes from the March FOMC meeting. We follow up with a note on balance sheet runoff and the market’s reaction to today’s release of the minutes. We then recap some data South and North of the border in the form of Mexican vehicle production and the record Ivey PMI in Canada. We close out with a recap of this week’s petroleum stockpile data from the EIA.
If you’re wondering what the Closer is like each day, click here or on the thumbnail image below for a sample of a few pages from the report.

See today’s full post-market Closer and everything else Bespoke publishes by starting a 14-day trial to Bespoke Institutional today!


