While history never exactly repeats itself in the financial markets, variations of certain patterns tend to repeat themselves over time. Seasonal trends are one area where we often see recurring patterns of strength at certain times of the year and weakness at others, hence the advent of phrases like “Sell in May and Go Away.” To track these seasonal patterns in the equity market, each week we send Bespoke Premium and Bespoke Institutional clients a report that provides an analysis of the historical performance of the S&P 500, its ten sectors and individual stocks over the upcoming two-week period.
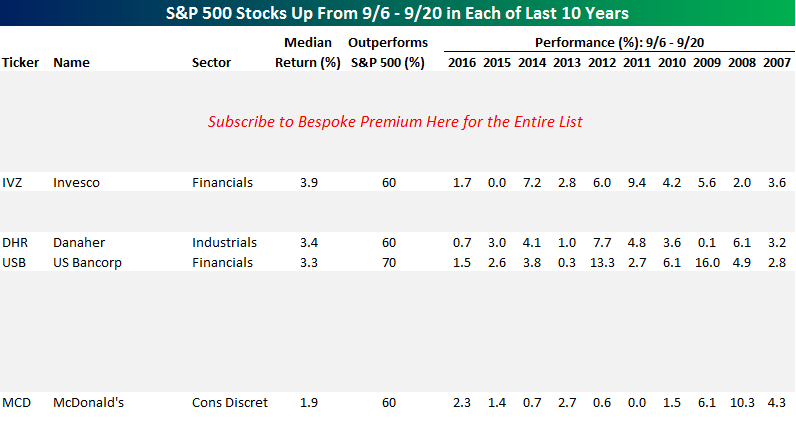
In this week’s report (sent out to clients earlier today), we noted that although September has historically been the weakest month of the year for equities, in the last ten years, the middle part of the month hasn’t been that bad. In fact, there were a number of bullish trends which really stand out. Among them was the fact that there are 17 current members of the S&P 500 that have been positive in the upcoming two-week period in each of the last ten years. That’s right, going back to 2006, these seventeen stocks have traded up in the two week period from 9/6 – 9/20. Below we have included a table which gives a sneak peak at some of the names that make up the seventeen on the list. To see the entire analysis and all seventeen names, sign up for a monthly Bespoke Premium membership now!
See the full S&P 500 Stock Seasonality report by signing up for a Bespoke Premium membership now.
