We’ve just released our weekly Sector Snapshot report (see a sample here) for Bespoke Premium and Bespoke Institutional members. Please log-in here to view the report if you’re already a member. If you’re not yet a subscriber and would like to see the report, please start a 30-day trial to Bespoke Premium now.
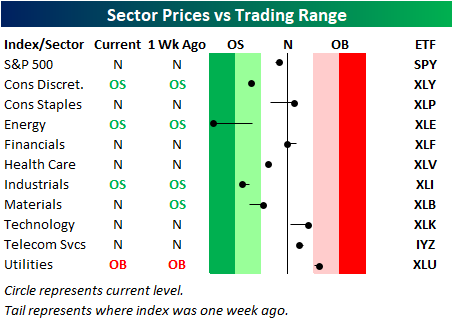
Below is one of the many charts included in this week’s Sector Snapshot, which shows our trading range screen for the S&P 500 and ten sectors. The black vertical “N” line represents each sector’s 50-day moving average, and as you can see, the S&P and six sectors have moved below their 50-days.
To see our full Sector Snapshot with additional commentary plus six pages of charts that include analysis of valuations, breadth, technicals, and relative strength, start a 30-day free trial to our Bespoke Premium package now. Here’s a breakdown of the products you’ll receive.
