Feb 21, 2017
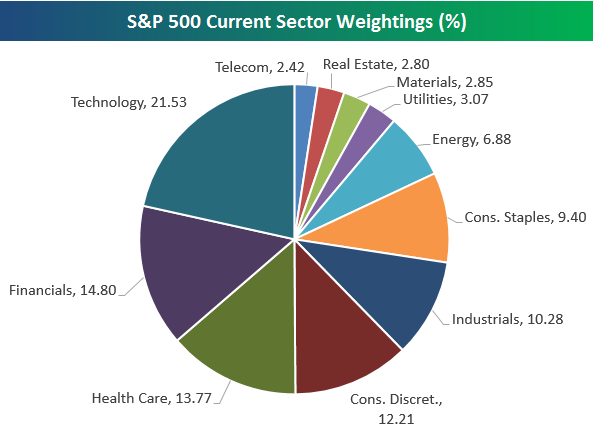
Below is a look at current S&P 500 sector weightings using GICS standards. As shown, Technology’s weighting now stands at 21.53%, making it the biggest sector by a wide margin. The Financial sector is the second largest with a weighting of 14.8%. Remember, though, that the REITs were recently given their own sector, which lowered the weighting of the Financial sector by over two-and-a-half percentage points. If the Financial sector still contained the REITs, its weighting would be 17.6%.
Below is a look at the change in sector weightings since Election day last November 8th. As shown, the Financial sector has seen the biggest jump by far at 1.4 percentage points. The only other sector that has seen a meaningful jump is Industrials (+0.20 percentage points). On the downside, we’ve seen Consumer Staples, Energy, Health Care, Utilities, Real Estate, Telecom, and Consumer Discretionary all lose share since election day.
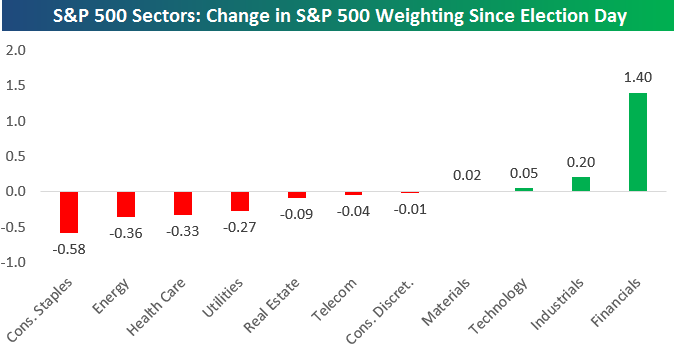
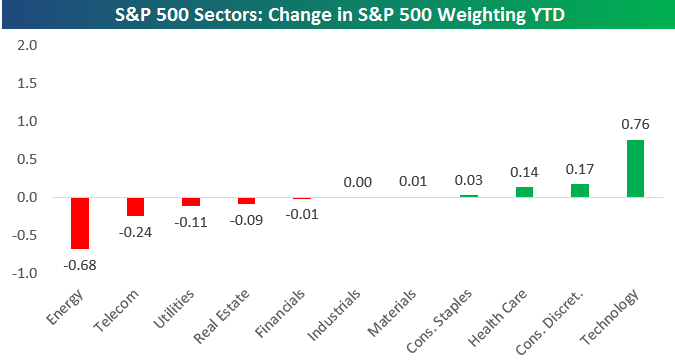
If we look at changes in sector weightings so far in 2017, things look quite different versus the change since Election day. Since the start of 2017, the Technology sector has seen the biggest jump in its weighting at 0.76 percentage points. The Consumer Discretionary has seen the next biggest jump at 0.17 percentage points.
While the Financial sector has seen the biggest jump in weighting since Election day, it has actually lost share since the start of the year. So all of its post-Trump gains in share came in 2016.
Dec 27, 2016
 Our 2017 Bespoke Report market outlook is the most important piece of research that Bespoke publishes each year. We’ve been publishing our annual outlook piece since the formation of Bespoke in 2007, and it gets better and better each year! In this year’s edition, we’ll be covering every important topic you can think of dealing with financial markets as we enter 2017. And to say that 2017 should be an interesting year for asset classes would be an understatement given the huge rotation we’ve already seen in just a few weeks since the Presidential Election was held back on November 8th.
The 2017 Bespoke Report contains sections like Washington and Markets, Economic Cycles, Market Cycles, Washington, Sector Technicals and Weightings, Stock Market Sentiment, Stock Market Seasonality, Housing, Commodities, and more. In this year’s edition, we’ll also be featuring our new “Trump Index” of stocks that we expect to perform best in 2017 based on the new administration.
Over the next week until the full publication is sent to paid members on December 29th, we’ll be releasing individual sections as we complete them. Today we have published the “Sector Weightings and Technicals” section of the 2017 Bespoke Report, which provides our technical take on the long-term chart patterns of the major S&P 500 sectors.
To view this section immediately and also receive the full 2017 Bespoke Report when it’s published on December 29th, simply sign up for a 30-day free trial to Bespoke Premium. It’s that easy!
Nov 30, 2016
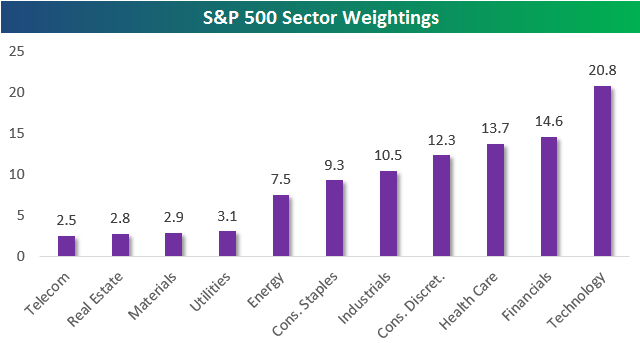
Below is an updated look at sector weightings in the S&P 500. As shown, Technology remains the largest sector in the index at 20.8%, while the Financial sector has moved back into second at 14.6%. Health Care ranks third at 13.7%, followed by Consumer Discretionary (12.3%), Industrials (10.5%), and Consumer Staples (9.3%). Energy ranks seventh at 7.5%, and the final four sectors (Utilities, Materials, Real Estate, Telecom) all have weightings between 2.5% and 3.1%.
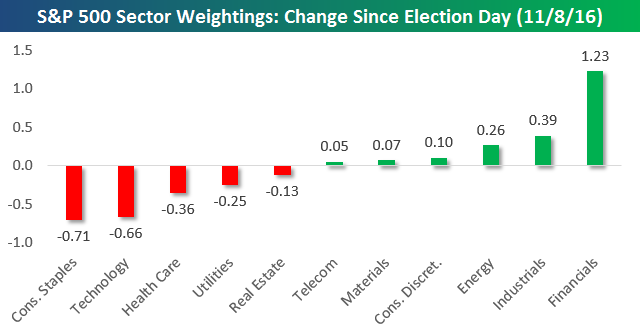
What’s most interesting about sector weightings is their changes over time. We post on this topic from time to time, but today we just want to show how weightings have changed since Trump was elected President on November 8th. As shown, the Financial sector has seen its weighting in the S&P 500 surge by 1.23 percentage points. The Industrials sector has seen the next biggest jump at 0.39 percentage points, followed by Energy (0.26) and Consumer Discretionary (0.10).
On the downside, Real Estate, Utilities, Health Care, Technology, and Consumer Staples have all lost market share since the election, with Consumer Staples losing the most at 0.71 percentage points. Due to its “growthy” nature, we’re wondering if Technology will be able to hold above 20% for much longer.
Sep 28, 2016
This content is for members only
Aug 2, 2016
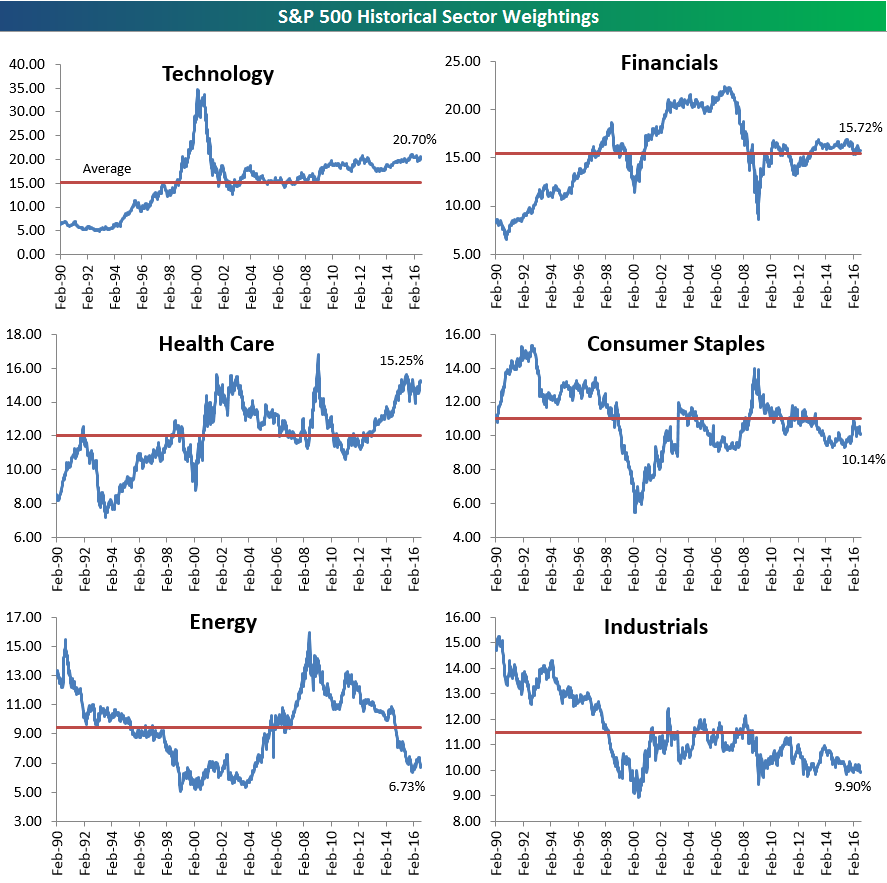
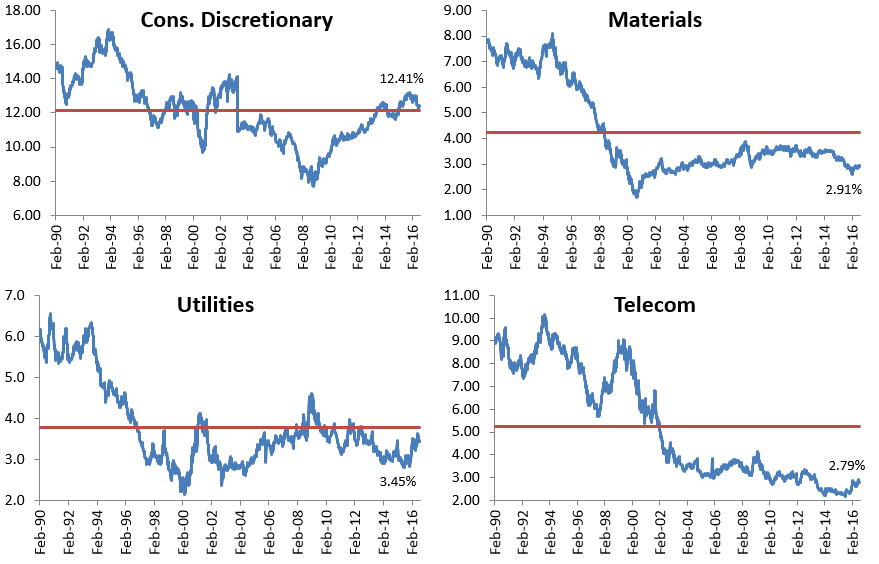
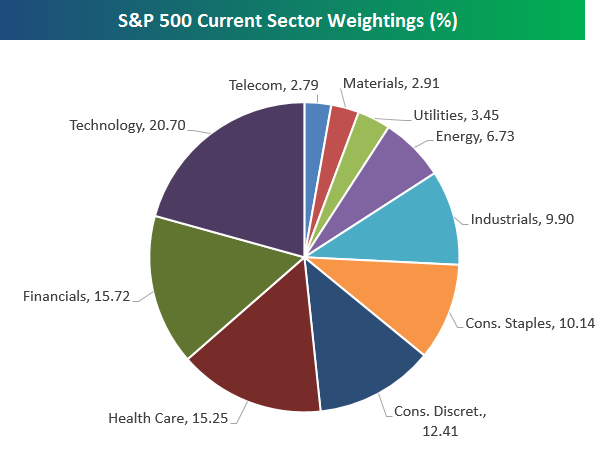
Below is an updated snapshot of current S&P 500 sector weightings. As of the close yesterday, the Technology sector’s weighting had crept up to 20.70%. That’s just about five percentage points higher than the next biggest sector — Financials — at 15.72%. Health Care has really outperformed lately, bringing its weighting up to 15.25%. The three largest sectors — Technology, Financials, Health Care — now make up more than 50% of the market (51.67% to be exact)! The three smallest sectors — Telecom, Utilities and Materials — only make up 9.15% of the market. It’s also worth noting that the Energy sector’s weighting has dipped back below 7% once again as oil prices have entered a new bear market.
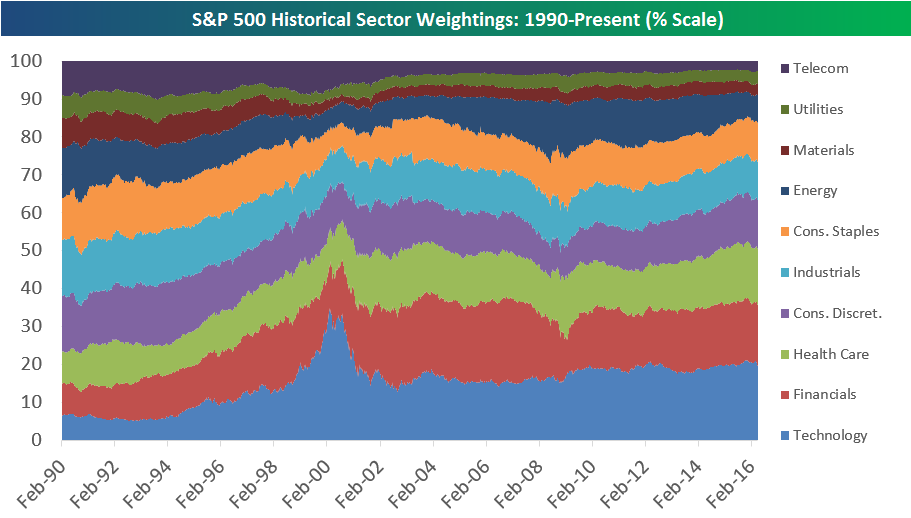
Below is a historical look at S&P 500 sector weightings going back to 1990. This allows you to see how the US has shifted from a more balanced economy to one that is now dominated by non-manufacturing sectors. We mentioned above that the three largest sectors now make up more than 50% of the market while the smallest three make up just 9.15%. Back in 1990, the three largest accounted for 42% of the market, while the three smallest had a combined weighting of 20.30%.
In the chart below, the Tech bubble of the late 1990s also stands out. In February 1990, the Tech sector had a weighting of just 6.34%. It was the second smallest sector at that time ahead of only Utilities which had a weighting of 6.18%. By the peak of the Tech bubble in March 2000, the Technology sector’s weighting had risen to 34.81%! After the Tech bust, it was the Financial sector’s turn to take the reigns. By September 2006, the Financial sector’s weighting had ballooned up to 22.35%. That put it more than seven percentage points larger than Tech, which was the second largest sector at the time with a weighting of 15.19%. The Financial sector’s purpose is to service the economy. Anytime that sector ends up becoming the largest sector of the market, it’s a sign that things are off kilter.
Below we provide historical weighting charts by sector going back to 1990. For each sector, the red line represents its average weighting over the entire 26-year period. This allows you to see which sectors are currently above or below their long-term averages. At the moment, Technology and Health Care are the only two sectors solidly above their long-term averages. Energy, Industrials, Materials and Telecom are the farthest below.