Nov 22, 2017
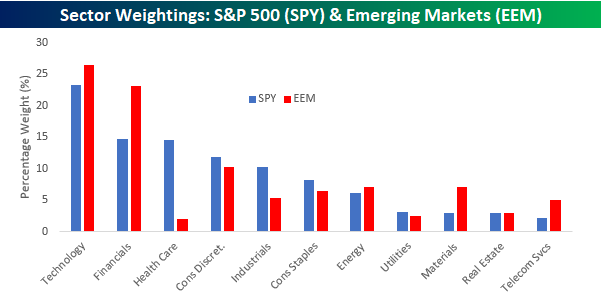
If we had a bitcoin for every time we heard someone say that the S&P 500 has been too reliant on the performance of tech stocks for its gains this year, we would be very rich. But if you think the S&P 500 is dangerously overweighted towards the Technology sector, beware of emerging markets. While the Technology sector’s 23% weighting in the S&P 500 makes it by far the largest sector in the index, the ETF tracking Emerging Markets (EEM) is even more heavily weighted towards technology. The chart below compares sector weightings in the ETFs that track the S&P 500 (SPY) and Emerging Markets (EEM). As you can see, Technology has a 26.5% weighting in EEM. So if you think the S&P 500 is too top heavy with tech, EEM is even more exposed.
In addition to the large weighting in tech, EEM also has a lot of exposure to Financials. That sector’s weighting is nearly 60% larger in EEM (23.1%) than it is in SPY (14.6%). With such large weightings in both sectors, just under half of EEM’s weighting is in Technology and Financials. So where is EEM underweighted relative to SPY? That would be in the Health Care sector. As shown below, Health Care accounts for 14.5% of SPY, but the sector’s weighting in EEM is a puny 1.95%.
Nov 22, 2017
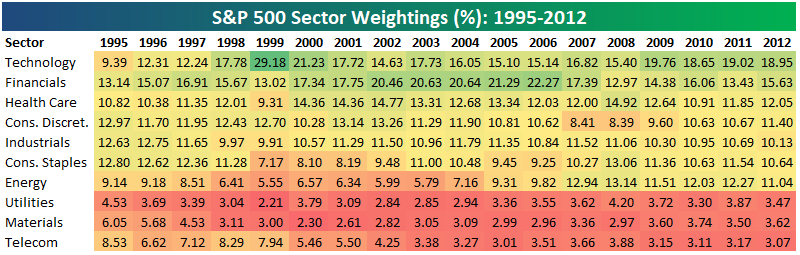
S&P 500 sector weightings are important to monitor. Over the years when weightings have gotten extremely lopsided for one or two sectors, it hasn’t ended well. Below is a table showing S&P 500 sector weightings from the mid-1990s through 2012. In the early 1990s before the Dot Com bubble, the US economy was much more evenly weighted between manufacturing sectors and service sectors. Sector weightings were bunched together between 6% and 14% across the board. In 1990, Tech was tied for the smallest sector of the market at 6.3%, while Industrials was the largest at 14.7%. The spread between the largest and smallest sectors back then was just over 8 percentage points.
The Dot Com bubble completely blew up the balanced economy, and looking back you can clearly see how lopsided things had become. Once the Tech bubble burst, it was the Financial sector that began its charge towards dominance. The Financial sector’s sole purpose is to service the economy, so in our view you never want to see the Financial sector make up the largest portion of the economy. That was the case from 2002 to 2007, though, and we all know how that ended.
Unfortunately we’ve begun to see sector weightings get extremely out of whack again as 2017 comes to an end.
If you would like to see the most up-to-date numbers for S&P 500 sector weightings, simply start a two-week free trial to our Bespoke Premium or Bespoke Institutional service. Click back to this post once you’re signed up to see the numbers.
Oct 20, 2017
S&P 500 sector weightings are important to monitor. Over the years when weightings have gotten extremely lopsided for one or two sectors, it hasn’t ended well. Below is a table showing S&P 500 sector weightings from the mid-1990s through 2012. In the early 1990s before the Dot Com bubble, the US economy was much more evenly weighted between manufacturing sectors and service sectors. Sector weightings were bunched together between 6% and 14% across the board. In 1990, Tech was tied for the smallest sector of the market at 6.3%, while Industrials was the largest at 14.7%. The spread between the largest and smallest sectors back then was just over 8 percentage points.
The Dot Com bubble completely blew up the balanced economy, and looking back you can clearly see how lopsided things had become. Once the Tech bubble burst, it was the Financial sector that began its charge towards dominance. The Financial sector’s sole purpose is to service the economy, so in our view you never want to see the Financial sector make up the largest portion of the economy. That was the case from 2002 to 2007, though, and we all know how that ended.
If you would like to see the most up-to-date numbers for S&P 500 sector weightings, simply start a two-week free trial to our Bespoke Premium or Bespoke Institutional service. Click back to this post once you’re signed up to see the numbers.
Aug 14, 2017
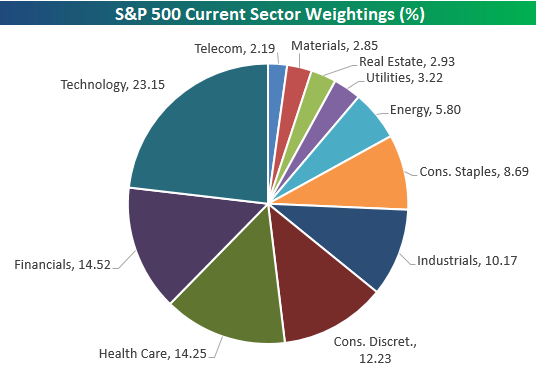
Below is an updated look at where S&P 500 sector weightings stand as of August 14th, 2017. The Technology sector’s weighting remains above 23% at 23.15%. That’s just 22 basis points below its multi-year high of 23.37% set during the week of June 9th, 2017. Financials and Health Care are battling it out in second and third place with weightings of 14.52% and 14.25%, respectively.
Consumer Discretionary ranks fourth at 12.23%, Industrials is fifth at 10.17%, and Consumer Staples is sixth at 8.69%. Consumer Staples just dipped to its lowest weighting since March 2002!

Below is a look at S&P 500 sector weightings going back to 1990. This allows you to see how things have shifted over the years. In the early 90s prior to the Tech bubble, the economy was much more evenly distributed. In early 1990, Industrials was the largest sector of the market at 14.72%. That’s 8.5 percentage points below Tech’s weighting now. In 1990, Technology was actually the second smallest in the S&P 500 with a weighting of 6.34%! How times have changed.
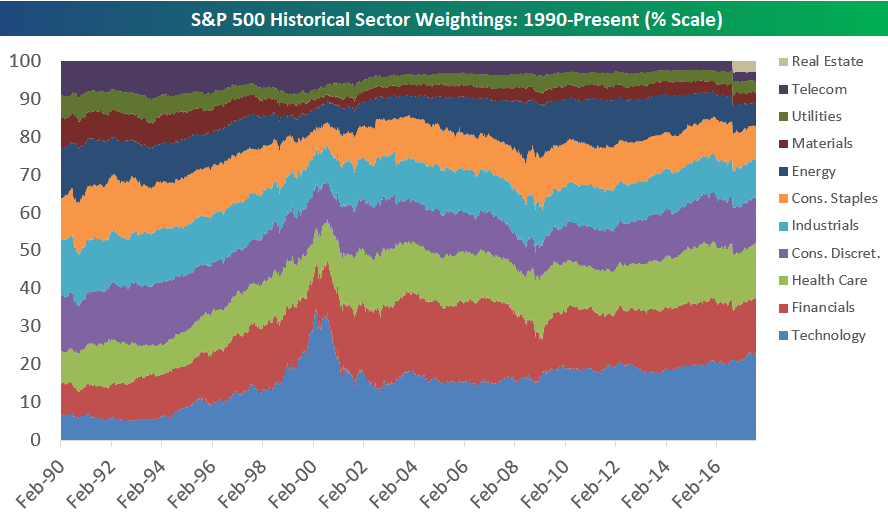
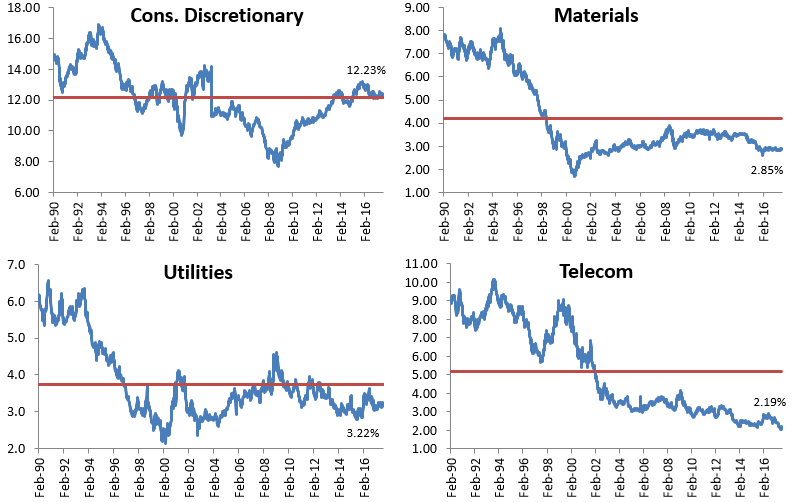
The charts below break out the path of each sector’s S&P 500 weighting over time. The red line in each chart represents the sector’s average weighting over the entire time frame, so you can see which sectors are currently the furthest above or below their long-term averages. Technology and Health Care are the only two sectors currently well above their long-term averages. Consumer Staples, Energy, Industrials, Materials, Telecom and Utilities are all well below their long-term averages.