Mar 13, 2017
Learn more about Bespoke’s research and wealth management services.
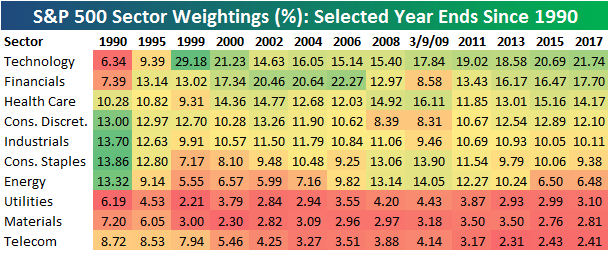
March 9th marked the 8-year anniversary since the 2009 Financial Crisis lows, and one of the topics we wanted to write about surrounding the 8-year mark was S&P 500 sector weightings. Below is a table highlighting the percentage weighting of each sector as of the end of each year shown. We’ve included weightings as of the close on 3/9/09 (the “low”) as well.
Back in 1990, there were four sectors at the top of the food chain — Consumer Discretionary, Consumer Staples, Industrials, and Energy. The Technology sector had the second smallest weighting at just 6.34%, while the Financial sector was the fourth smallest. As the 1990s progressed, the US continued a huge shift from primarily a manufacturing economy to a services economy. Once the Dot Com bubble took hold, the Technology sector’s weighting shot up, and the Financial sector trailed it higher. By the end of the 90s, the Technology sector’s weighting had ballooned to 29.18%, which was more than 16 percentage points larger than the next closest sector. That was clearly not sustainable, and within 3 years the Tech sector’s weighting was more than cut in half.
From 2002 through 2006, the Financial sector had the largest weighting in the economy. At the end of 2006, the Financials made up 22.27% of the S&P 500, which was more than 7 percentage points above the next closest sector. The Financial sector exists to service the economy, and that fact alone should tell you that something isn’t right when the Financial sector is by far the largest sector of the market. Cue the Financial Crisis…
From the end of 2006 through the low on March 9th, 2009, the Financial sector’s weighting in the S&P dropped from 22.27% to 8.58%. At the lows, the Financial sector had dropped from the largest sector to the fifth smallest.
Over the last 8 years, we’ve seen the Technology sector remain on top the whole time, and as of March 2017, it’s weighting stands at 21.74%. That’s not nearly as elevated as it was in 1999, but it is starting to creep up to levels that make you squeamish.
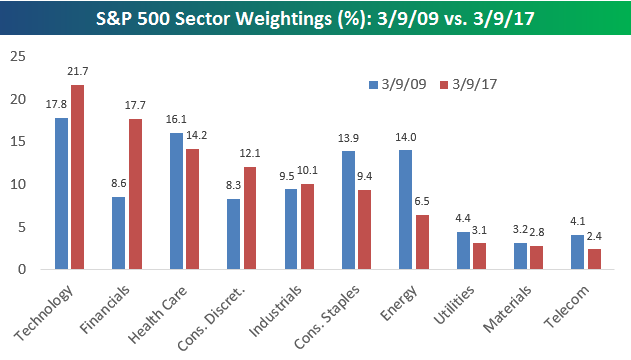
We mentioned early on that back in 1990, the four largest sectors were Consumer Discretionary, Consumer Staples, Industrials, and Energy. Fast forward 27 years to today, and those four sectors are now the 4th through 7th largest. Technology, Financials, and Health Care currently hold the top three spots — making up nearly 54% of the market. The bottom three sectors make up less than 9% of the market today, while the bottom three made up 20% back in 1990. Along with the shift from manufacturing to services, the economy today is much more top heavy.
(One thing to note is that in 2016, S&P added the “Real Estate” sector in order to remove REITs from the Financial sector. In order to make an apples to apples comparison from a historical perspective, we’ve added the Real Estate sector’s current weighting back into the Financial sector.)
To see Bespoke’s full line of macro and micro research, sign up for one of our premium membership options today! You won’t be disappointed.
Jun 19, 2016
Start a 14-day no-obligation free trial to Bespoke’s research platform to get top-level market analysis on a daily basis.
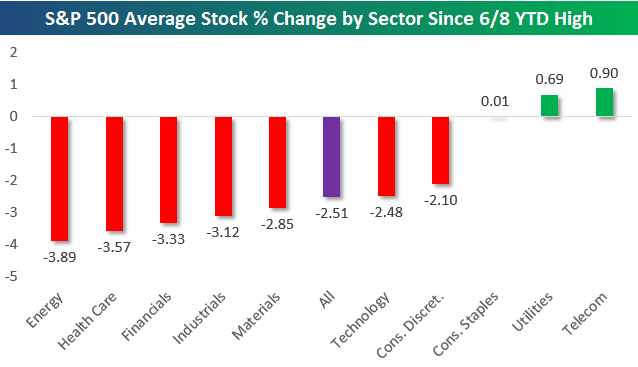
The S&P 500 closed at its year-to-date high on June 8th, and since then the average stock in the index is down 2.51%. Below is a chart showing the average change for stocks by sector since the June 8th close. Three sectors have averaged gains since 6/8, and they’re all defensive in nature — Telecom, Utilities, and Consumer Staples. Consumer Discretionary and Technology stocks have done slightly better than average with declines of 2.10% and 2.48%, respectively. The sectors that have seen their stocks fall the most since June 8th — thus leading the market lower — are Energy (-3.89%), Health Care (-3.57%), Financials (-3.33%), and Industrials (-3.12%).
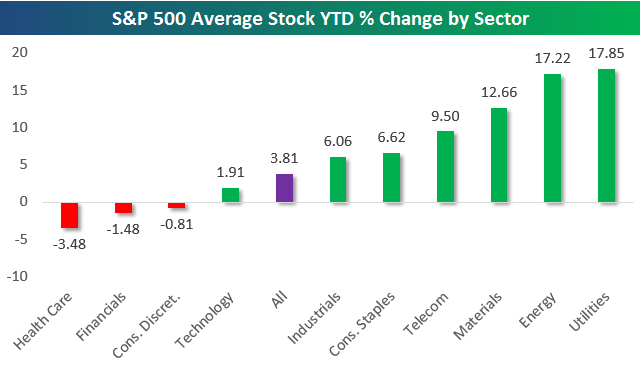
Things look much different when we look at the average stock’s change by sector on a year-to-date basis. The average stock in the S&P 500 has gained 3.81% so far in 2016, but six of ten sectors have seen their stocks average even bigger gains than that — some much bigger. The problem, though, is that the four sectors whose stocks have underperformed the broad-market average are the four biggest sectors. Technology has the biggest weighting in the S&P, and its average stock is up just 1.91% — half that of the average stock in the S&P 500 as a whole. The average stock in the Consumer Discretionary, Financials, and Health Care sectors is in the red on the year.
On the plus side, Utilities and Energy stocks are up an average of 17%+ so far in 2016. Materials stocks are up an average of 12.66%, while Telecom, Consumer Staples, and Industrials stocks are averaging gains of 5%+.
Usually you see the sectors with the largest weightings lead the market higher, but so far this year, it’s the six smallest sectors that have collectively led the way.
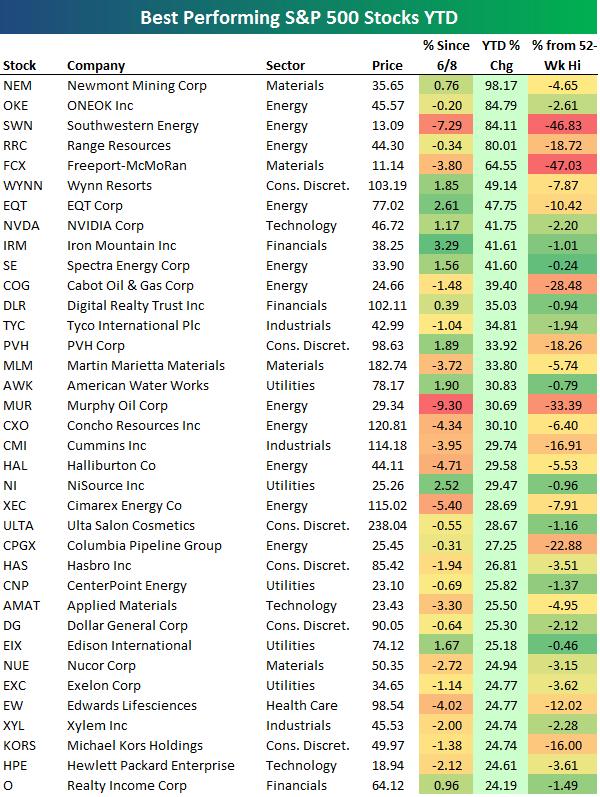
Below is a list of the best performing S&P 500 stocks year-to-date. You’ll notice that not one stock is up more than 100%, while just five are up more than 50%. Gold-miner Newmont (NEM) is up the most with a gain of 98.17%, followed by three Energy stocks — ONEOK (OKE), Southwestern Energy (SWN), and Range Resources (RRC). Freeport-McMoRan (FCX) rounds out the top five with a YTD gain of 64.55%.
Wynn Resorts (WYNN) ranks sixth with a gain of 49.14%, and stocks like NVIDIA (NVDA), Cummins (CMI), Halliburton (HAL), Ulta Salon (ULTA), Hasbro (HAS), Dollar General (DG), and Michael Kors (KORS) are other notables on the list of winners.
Endo International (ENDP) is down more than any other stock in the S&P 500 in 2016 with a huge decline of 73.15%. That’s nearly double the second worst stock — Seagate Technology (STX) — which is down 36.66%. Ten other stocks are down more than 30%, including Marathon Petroleum (MPC), Regeneron Pharma (REGN), Alexion Pharma (ALXN), Signet Jewelers (SIG), and Vertex Pharma (VRTX). Other notable stocks on the list of 2016’s biggest losers include First Solar (FSLR), TripAdvisor (TRIP), Delta Air (DAL), Nordstrom (JWN), Kohl’s (KSS), Biogen (BIIB), Legg Mason (LM), Morgan Stanley (MS), Bank of America (BAC), and Harman (HAR).

Jul 30, 2015

This morning we sent a report to subscribers taking a look at the most loved and hated stocks in the S&P 500. In the report we show stocks that have the highest percentage of Buy and Sell ratings, and which stocks have seen the biggest increases and decreases in Buy and Sell ratings this year. From this morning’s report, we combined all ratings in the index to create the chart below. There are just under 11,900 individual analyst ratings on stocks in the S&P 500, which equates to just under 24 analyst ratings per stock! Of the 11,879 ratings, 5,859 are Buy ratings, 5,251 are Hold ratings, and just 769 are Sell ratings. Analysts have never been a very bearish bunch.
Below is another chart we created from this morning’s report showing the percentage of Buy ratings by sector. As shown, for the S&P 500 as a whole, 51% of all ratings are Buy ratings. Sectors that have a higher percentage of Buy ratings are Health Care, Energy, Technology and Industrials. Sectors that have a lower percentage of Buy ratings are Consumer Discretionary, Materials, Financials, Consumer Staples, Telecom and Utilities.
To view our “Most Loved and Hated Stocks” report, sign up for a 5-day free Bespoke Premium trial at this link.

Yesterday, we sent Bespoke Premium and Bespoke Institutional subscribers an updated look at S&P 500 sector weightings and how they have changed over the last 25 years. The chart below (pulled from the report) shows current sector weightings for the S&P 500. As shown, Technology is the biggest sector of the market at 19.83%. Financials ranks second at 16.79%, while Health Care ranks third at 15.55%. Consumer Discretionary, Industrials and Consumer Staples rank four, five and six, and then Energy ranks 7th with a 7.31% weighting. The bottom three sectors make up a very small portion of the S&P 500. Combined, Telecom, Utilities and Materials make up just 7% of the index, which isn’t even as big as Energy (the 4th smallest sector).
Given its recent drop as the broad market remains near all-time highs, the Energy sector has really taken a hit in terms of its market weighting. Below is a historical chart of Energy’s weighting in the S&P 500. At its peak in 2008, Energy made up nearly 17% of the index, but since then it has given up nearly 10 percentage points to fall well below its historical average (red line).
To view our “Trends in Sector Weightings Over the Last 25 Years” report, sign up for a 5-day free Bespoke Premium trial at this link.

Dec 27, 2024
Our Bespoke Report – 2024 Recap is now available for Bespoke subscribers. This report is a must-read rundown of everything that went on across financial markets in 2024. Below is a look at some of the topics covered:
- The year in headlines
- Thematic performance
- Seasonality
- Sector performance
- Sector weightings
- Mega-caps
- Earnings triple plays
- International markets
- Earnings themes
- ETF performance matrix
You can read our 2024 Recap by signing up for our 2025 All Access Special that gets you the first two months of Bespoke Institutional access for just $20, or start a two-week trial to our Bespoke Premium plan. You can review our membership plans here to help make your decision.

Nov 25, 2024
Log-in here if you’re a member with access to the Closer.
Looking for deeper insight into markets? In tonight’s Closer sent to Bespoke Institutional clients, we look at the new highs for small caps after a drawdown that lasted three years and what that means for forward returns as well as which sectors have driven small caps (page 1). We then dive into the differences between small and large cap sector weightings with a focus on the Industrial sector (page 2), before moving on to a look at the 15 small cap industrials which have performed best since the last time the index was at a record (page 3). Finally, we preview 5 and 7 year note auctions later this week and review today’s 2 year note auction before discussing what drove the big Treasury rally today (page 4).

See today’s full post-market Closer and everything else Bespoke publishes by starting a 14-day trial to Bespoke Institutional today!


