S&P 500 Sector Weightings
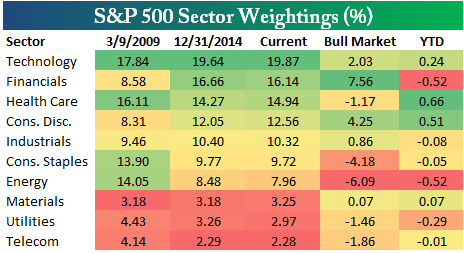
Below is an updated look at the S&P 500’s sector weightings. For each sector, we note its current weighting in the S&P 500, its weighting at the end of 2014, and its weighting at the start of the bull market on 3/9/09. As shown, Technology is still on top with a weighting of 19.87%. Tech has been the largest sector throughout the entire bull market, but it has been stable around or just below the 20% mark the entire time. The Financial sector ranks second with a weighting of 16.14%, followed by Health Care at 14.94% and then Consumer Discretionary at 12.56%.
So far this year, Technology, Health Care and Consumer Discretionary have seen the largest increases in weighting, while Financials, Energy and Utilities have seen the largest decreases.

Below is a chart showing the historical weighting of the largest sector in the S&P 500 going back to 1990. The color coding highlights which sector was the largest in the index at the time. As shown, Technology didn’t become the largest sector of the market until the late 1990s when the Dot Com bubble was in full boom. As you can see, its weighting absolutely sky-rocketed at the peak of the Tech bubble — getting as high as 35% at the top. As mentioned earlier, Tech has been the largest sector in the S&P 500 throughout the current bull market as well, but its weighting isn’t nearly as high as it was during the prior bubble.
After the Dot Com bust, the Financial sector took over the top spot in the S&P 500, and the housing/credit bubble pushed its weighting in the index up towards 23% at the peak. You can see the impact that the Financial Crisis had on the sector and the market as a whole, as the largest sector in the S&P only made up roughly 15% of the index at the bear market lows in late 2008/early 2009.
You have to go all the way back to the start of 1996 to find a sector other than Technology or Financials that held the top spot in terms of weighting. The last time a sector outside of Tech or Financials had the largest weighting in the S&P 500 was January 12th, 1996, when Consumer Discretionary held the top spot with a 13.01% weighting. Sector weightings were much more evenly distributed back then. Now, the top three sectors make up 51% of the index, while the bottom three only make up 8.5%.
