ISM Offsides, If Not Utterly Incorrect
This week’s manufacturing activity releases from the New York Fed and Philly Fed showed a slightly weaker but generally upbeat assessment of economic activity. The numbers from these two regional surveys may not be fully representative of the aggregate national economy, but they’re usually a pretty good indicator. As shown in the chart below, they’ve been a decent guide to what the ISM Manufacturing index says about national activity since the Empire State manufacturing index started its releases in 2001.
Unlike these two indices, which have shown a general uptick in activity over the last few months, the ISM index shows a different route. But that data isn’t backed up by the average results across the five Fed districts that survey their manufacturers. The size and scale of the divergence is so big that one of these indices is almost certainly wrong, but which?
For a tiebreaker, Markit’s manufacturing survey suggests conditions are at multi-month highs and picking up, more consistent with the data from Fed surveys than ISM. Markit’s sample size is bigger and the index is more representative of the whole sector than ISM only; with all five regional Fed surveys in the mix, they also have a sample size advantage over ISM. Hard data of late (including manufacturing production, exports, and hiring) has all sided against ISM and is showing data more consistent with the Five Fed or Markit surveys. For now, it looks like the brutal ISM results are a bit overstated. Start a two-week free trial to Bespoke Institutional to unlock access to our actionable research and interactive tools.

Moving Abroad?
While the title may suggest it, this isn’t a political post geared towards Democrats who can’t stand President Trump or Republicans fearing the prospect of a President Warren or Sanders. What we’re talking about here is what could be early signs of a break in the nearly decade long trend of international stocks underperforming equities in the United States. The first chart below shows a long-term look at the relative strength of the MSCI Ex-US Index versus the S&P 500 going back to 1999. When the line is rising, it indicates outperformance on the part of international stocks (ROW), and when it is falling, US equities are outperforming.
While the first several years of this century were dominated by outperformance on the part of international stocks at the expense of the S&P 500, that trend reversed with the Global Financial Crisis as international stocks had given up all of their outperformance by 2012, and then continued to lag going forward. The lower chart shows a closer look at the relative strength between the two indices over the last year. Here, it has been mostly more of the same. Outside of a brief surge during the Q4 market rout late last year, ROW has underperformed the S&P 500 for pretty much all of 2019. That is up until recently. Since late August, the relative strength line of the ROW has actually been drifting higher. Granted, it’s not a major shift at this point, but you have to start somewhere, and as of now ROW’s relative strength is near a four-month high.
For emerging markets (EM), the trend has been nearly identical to that of the ROW. The charts below are the same as the ones above, except instead of the MSCI World Ex-US index, we substituted in the MSCI Emerging Markets Index. Here, it’s been a similar story as relative strength in EM peaked just after the Financial Crisis and has been drifting lower ever since. While EM hasn’t given up all of its outperformance from the earlier part of this century, it has given up most of it and is now right near multi-year lows. Like the picture for ROW, though, it’s still early, but in the last couple of months, the relative strength for EM has been slowly drifting higher and is now near three-month highs. Start a two-week free trial to Bespoke Institutional to unlock access to our actionable research and interactive tools.

Dividend Stock Spotlight: International Business Machines (IBM)
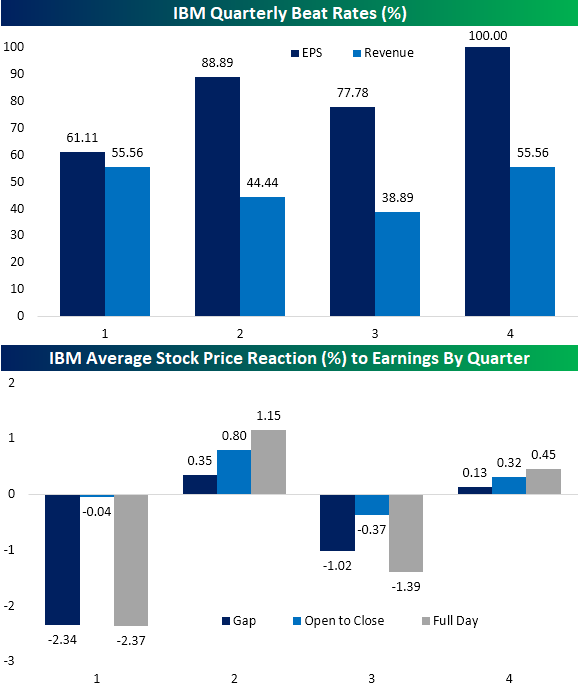
After Wednesday’s close, investors got third-quarter results from blue-chip technology giant International Business Machines (IBM). Consensus analyst forecasts were calling for EPS of $2.66 and revenues of $18.285 billion. While IBM beat EPS by two cents, revenues were more than $250 million below forecasts and down 3.9% year-over-year (the fifth straight quarter with revenues lower than the previous year) even with the boost from newly acquired cloud computing company Red Hat which had stronger revenues In reaction to this miss at the top line, IBM’s stock declined 5.52% in trading on Thursday on elevated volumes.
Putting this week’s report into historical context, Q3 has been one of the weakest quarters in terms of beat rates as well as stock price reaction for IBM. Since 2000, IBM has only reported better than expected revenues in Q3 38.89% of the time, the lowest of any quarter. The EPS beat rate of 77.78% could also be better but is better than Q1’s 61.11%. Given this, Q1 and Q3 stock price reaction to earnings have been less frequently positive with IBM’s stock rising only 22% and 33% of the time, respectively. Q1 has actually been the weakest quarter as IBM has averaged a full day decline of 2.37%, most of which comes at the opening gap. Q3 is the next weakest quarter with an average decline of 1.39%. In other words, while yesterday’s decline was larger than expected, it is not unusual for the stock to be weak in Q3.
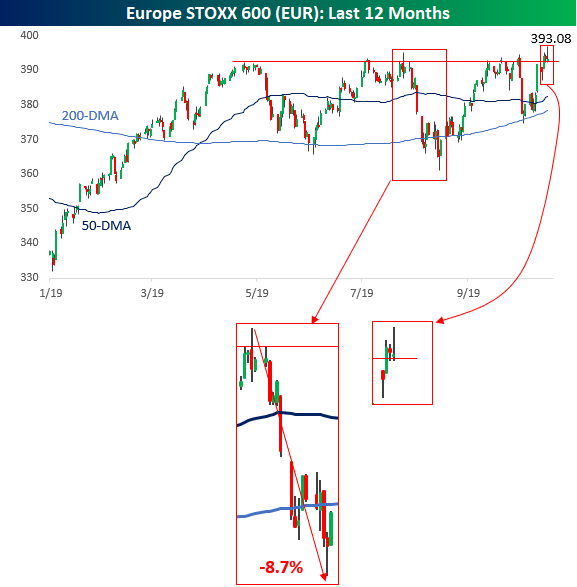
As a result of Thursday’s decline, IBM traded down through both its 50 and 200-DMA and now trades at the lower end of the past year’s range. The decline also pushed IBM’s dividend yield up to 4.83%, which is the highest yield of all S&P 500 technology stocks. It also has the third-highest yield of the 30 Dow stocks behind only Exxon Mobil (XOM) and Dow (DOW). Although the payout ratio is around the highest levels of the past 20 years at 85.8%, meaning further dividend growth given the slowing pace of revenues could come into question, 2019 marked the 24th consecutive year that IBM raised its dividend. Given this, if IBM raises the dividend again in 2020, the stock could potentially join the Dividend Aristocrats—a group of stocks with 25+ straight years of a growing dividend. If this were to happen, IBM would join Automatic Data Processing (ADP) as the only Technology stocks in the group. Additionally, at current yield levels, IBM would also be the fourth-highest yielder of the Dividend Aristocrats, behind AbbVie (ABBV), AT&T (T), and Exxon Mobil (XOM). Start a two-week free trial to Bespoke Institutional to access our interactive chart screens and much more.

Nasadaq – One Downtrend Down, Another To Go
In a post yesterday, we discussed the seemingly never-ending rangebound trading pattern for the STOXX 600. It’s not just Europe either. Seemingly everywhere you look these days, there’s a major equity index stuck in some sort of range. The Nasdaq is just one example of many. At a level of around 8,140, the Nasdaq is at the same level it was at exactly six months ago and also all the way back in August of last year.
Last week at this time, things were looking good for the Nasdaq as the index had bounced off of support at its 200-DMA and broke its short-term downtrend from the September lower high. This week has seen further gains with the Nasdaq rising more than 1%, but that rally looks to have stalled out yesterday right at another downtrend from the July high. A meaningful break of that downtrend would come into play at around 8,200 which is just over half of one percent above current levels. Using our Trend Analyzer tool, of the 100 stocks in the Nasdaq 100, heading into today, 43 were overbought and just five were oversold, so it may take a few days of ‘rest’ for the index before a meaningful break of that downtrend can occur. Start a two-week free trial to Bespoke Institutional to unlock access to all of our interactive tools.

Bespoke’s Morning Lineup – 10/18/19
See what’s driving market performance around the world in today’s Morning Lineup. Bespoke’s Morning Lineup is the best way to start your trading day. Read it now by starting a two-week free trial to Bespoke Premium. CLICK HERE to learn more and start your free trial.

The Closer – Europe Rejections, Construction Cruising, Manufacturing Divergence – 10/17/19
Log-in here if you’re a member with access to the Closer.
Looking for deeper insight on markets? In tonight’s Closer sent to Bespoke Institutional clients, beginning with a technical note, we show the resistance European markets have run into and the breakdown in the dollar. Moving onto economic data, we show the pause in September home construction data. We then provide an update to our Five Fed Manufacturing Composite, including the massive divergence between the Empire and Philly Fed’s indices with ISM. We finish with a look at today’s EIA data.

See today’s post-market Closer and everything else Bespoke publishes by starting a 14-day free trial to Bespoke Institutional today!
Bespoke’s Sector Snapshot — 10/17/19
Rangebound on Both Sides of the Atlantic
Everyone here is well aware of the fact that equities have been stuck in what seems like an endless trading range where the S&P 500 has failed to break out meaningfully to new highs. What some investors may not be of cognizant of is the fact that over in Europe, the benchmark STOXX 600 has also been stuck in a trading range of its own. While the index peaked at higher levels in 2015, it subsequently fell over 25% during the global sell-off in late 2015/early 2016. From those lows, the STOXX rallied more than 30% for the next 15 months. Since May 2017, though, the index has been stuck in a range and unable to meaningfully break out to new highs.
This year’s performance for the STOXX 600 has been a continuation of the holding pattern that the index has been stuck in since 2017. Earlier today, it looked as though we were getting close to a breakout as the index hit a 52-week high, but late in the European session equities sold-off nearly 1% from the intraday highs finishing near the lows of the day. Oh well. Maybe tomorrow.
What bulls in Europe are hoping is that today’s late-day sell-off isn’t a repeat of what happened on July 25th. Back then, we saw a similar-looking breakout, but like today, the gains didn’t hold and the STOXX 600 reversed over 1% and finished near the lows of the day. From the high on the day of that failed breakout in late July to the August lows, the STOXX 600 went on to fall nearly 9%. Start a two-week free trial to Bespoke Institutional to access our actionable research and interactive investment tools.
Positive Sentiment Surge
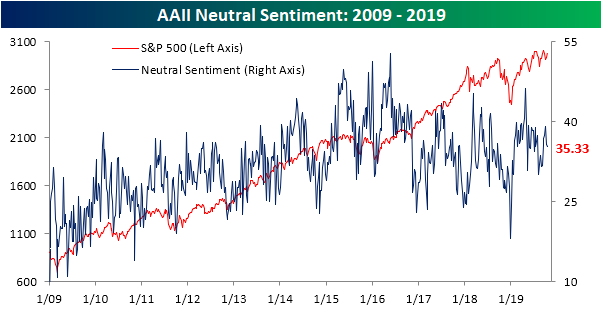
With the S&P 500 fighting to retake the 3000 level this week, bullish sentiment has rebounded after dropping to the lowest level since May of 2016 last week. AAII’s percentage of bullish investors rose from 20.31% last week to 33.62%. This brings the sentiment level back within its normal range of the past few years although it is still below the historical average of 38.08%.

This 13.31 percentage point increase was the largest since July 12th of last year when bullish sentiment rose 15.2 percentage points. This week was also the only time since then (66 weeks) that bullish sentiment has even risen by double digits in a single week. While there is plenty of precedence for weeks where bullish sentiment jumped 10 percentage points or more (163 past occurrences since the beginning of the survey in 1987), there has been only one other time that it happened without having done so for at least one year. That was in March of 2013 when bullish sentiment rose 14.36 percentage points, snapping a 116 week-long streak.
Granted it’s just one week, but the S&P 500 performance following that period was generally positive. The next week saw a decline of over 1%, but over the next month, 3 months, 6 months, and year the S&P 500 saw stronger than average returns. On the contrary, average S&P 500 performance following all 163 weeks with increases of 10 percentage points or more has not been as strong as it has actually led to underperformance for all time periods other than one week later.

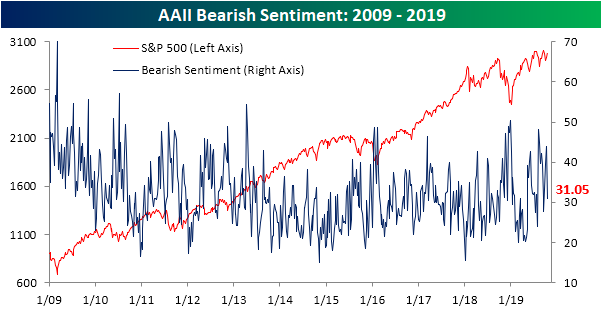
Given the sharp rise in bullish sentiment, bearish sentiment took a nosedive falling to 31.05% from 43.96% last week. While still slightly above the historical average, this drop brought it back down to Earth from its elevated levels. As with bullish sentiment, these sorts of large moves in a single week have not been a common occurrence; perhaps even more so for bearish sentiment. Since the beginning of the survey, there have been 141 weeks including the current week, or 8% of all weeks, where bearish sentiment has seen a double-digit percentage drop. This week’s 12.91 percentage point decline was the largest decline since the 13.4 percentage point move in the second week of this year in the wake of the 2018 sell-off. So unlike bullish sentiment, it has not been quite as long since we last have seen a similar decline but overall there have been fewer weeks with such a decline.
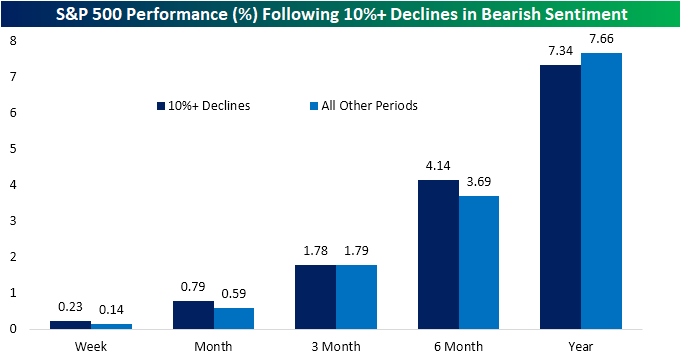
In terms of the S&P 500’s performance following similar declines, the average performance in the following months has been much more in line with the average for all other periods. There has been slight outperformance in the week, month, and 6-month time frames, but slight underperformance 3 months and one year later as shown in the chart below.
While most of the gain in bullish sentiment came from bears, a small portion also came from those formerly reporting as neutral. The reading on neutral sentiment fell 0.4 percentage points to 35.33% this week. Neutral sentiment is now off of its high from the start of October, but it also remains above its historical average of 31.54%. Start a two-week free trial to Bespoke Institutional to access our interactive economic indicators monitor and much more.
S&P 500 Sector Valuations
The S&P 500’s trailing 12-month P/E ratio has ticked up to 19.62 recently, which is close to its highest level of the past year. For valuations to stop expanding on any breakout higher for the S&P, we’ll need to see earnings (the “E” in P/E) keep up with price. That’s going to be a tough ask for corporate America this quarter, so we may be heading into 2020 with valuations at more concerning levels.
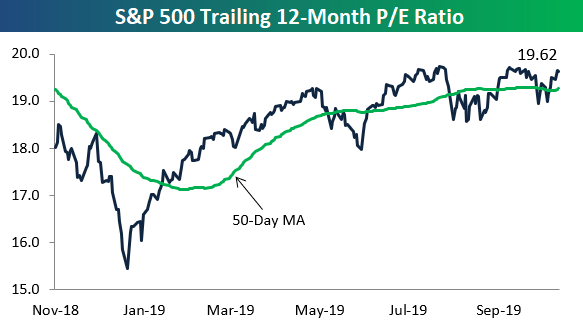
Below are one-year charts of P/E ratios for ten S&P 500 sectors. These charts are included in our weekly Sector Snapshot report sent to Bespoke Premium members. Consumer Discretionary has the highest P/E ratio at 24.15 followed by Technology at 23.38. Tech’s P/E has really jumped a lot recently to new 52-week highs. The Financial sector has the lowest P/E of the major sectors at just 13.27. Start a two-week free trial to Bespoke Premium to sample our actionable research. If you use this checkout link, you’ll receive a 10% discount on an annual membership if you stick with it past your trial period.

