Apple (AAPL) Cracks FANG
FANG is probably the most well-known acronym in the stock market these days, but if you’ve been following things lately, you know that this trade is no longer what it once was. 2017 was a banner year for the FANG group of Facebook (FB), Amazon (AMZN), Netflix (NFLX), and Alphabet (GOOGL), and the first half of 2018 was just as good. Because of FANG’s stumbles since mid-2018, however, you may be surprised to see that Apple (AAPL) — not an original FANG member — is now outperforming the group since the start of 2017. Apple’s (AAPL) recent gains leave it up 118.6% over this time period versus FANG’s gain of 93.2%. (Both AAPL and FANG have still more than doubled the S&P 500 since the start of 2017.)

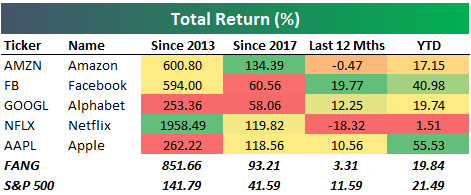
Below we compare the performance of Apple (AAPL) vs. FANG and the S&P 500 over three additional time frames. The first chart shows total returns over the last 12 months. Here, we’ve actually seen the S&P 500 outperform both AAPL and FANG, with FANG bringing up the rear at just +3.3%.

Year-to-date, Apple (AAPL) easily crushes both FANG and the S&P 500 with a gain of 55.5%. The S&P 500 is up the second most with a gain of 21.5%, while FANG is up just under 20% (19.8%).

Our final chart reminds you that there’s a reason why “FANG” became a thing. If we go back to 2013, which was the first full year that Facebook (FB) traded as a public company, FANG absolutely crushes the S&P and Apple (AAPL). While AAPL and the S&P are up significantly at +262.2% and 141.8%, respectively, the four FANG names have gained a whopping 851.7%.

Below is a table that breaks out the total returns for Apple (AAPL), Amazon (AMZN), Facebook (FB), Alphabet (GOOGL), Netflix (NFLX), FANG, and the S&P 500 over the four time periods shown in the charts above. While Netflix (NFLX) is actually down 18.3% over the last 12 months, it’s the biggest winner of them all since 2013 with a gain of 1,958%. Amazon (AMZN) has been the biggest winner since the start of 2017, while Facebook (FB) is up the most over the last 12 months. Apple (AAPL) only ranks first in the year-to-date column. Start a two-week free trial to Bespoke Premium to sample our most actionable investment research and receive access to all of our interactive tools. If you use this checkout link, you’ll receive a 10% discount on an annual membership if you stick with it past your trial period.
Banks – On To The Next Test
It has been a pretty monumental two weeks for the KBW Bank index. Since the close on 10/8, the index has rallied just under 9% as earnings reports from some of the largest US banks received a warm welcome from Wall Street. The index is now once again testing the top-end of its range, one which it has unsuccessfully tested multiple times in the last year. If you think the repeated tests of 3,000 for the S&P 500 over the last 18 months have been dramatic, the current go around with 103 for the KBW Bank Index has been the sixth such test in the last year! We would also note that prior to last year’s fourth quarter downturn, the same level that has been acting as resistance for the KBW Bank index was previously providing support.
In the case of each prior failed break above 103 for the KBW Bank index, sell-offs of at least 5% (and usually 10%+) followed, but one thing the index has going for it even if the sixth time isn’t the charm is that just yesterday it broke above its downtrend that has been in place since early 2018. The group has passed one test at least! From here, if we do see a pullback, that former downtrend line should provide support.

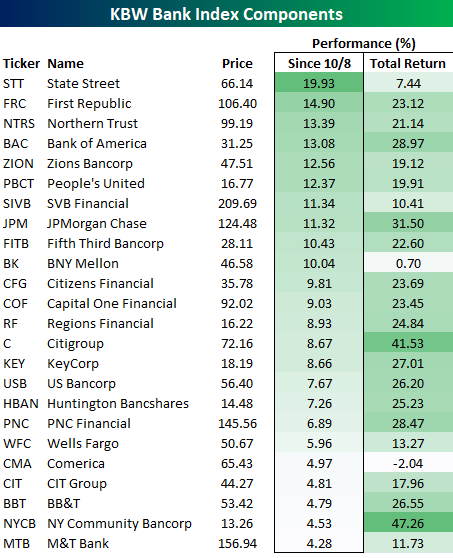
Turning to the KBW Index’s individual components, the table below lists each of the 24 stocks in the index along with how each one has performed since the index’s recent low on 10/8 and on a YTD basis (sorted by performance since 10/8). In the slightly more than two weeks since the index’s short-term low, every stock in the index is up and up by at least 4%. That’s a pretty broad rally!
Leading the way to the upside, State Street (STT) has rallied nearly 20%, while First Republic (FRC), Northern Trust (NTRS), and Bank of America (BAC) have jumped more than 13%. In the case of STT, the rally of the last two-weeks has also moved the stock into the green on a YTD basis. Start a two-week free trial to Bespoke Premium to sample our most actionable investment research and receive access to all of our interactive tools. If you use this checkout link, you’ll receive a 10% discount on an annual membership if you stick with it past your trial period.
Dividend Stock Spotlight: Medtronic (MDT)
Every Tuesday, we update our Bespoke Stock Scores which ranks each of the stocks in the S&P 1500 based on a fundamental, technical, and sentiment score which are then aggregated for an overall score in order to help investors generate ideas for further analysis. One of the top stocks this week was Health Care Equipment and Services company Medtronic (MDT) with a total score of 77.17 (any total score over 70 is considered to be positive). Given a high fundamental score (over 95), the stock has a solid valuation versus its peers and the technicals are also looking good. Currently, MDT has pulled back to oversold levels within the context of its longer-term uptrend which has also given it a ‘good’ timing score in our Trend Analyzer. Having risen 1.2% in today’s session, the stock has already begun to experience some mean reversion.
Additionally, Medtronic (MDT) is attractive as a dividend stock. MDT currently yields 2.67%, which is larger than the average for not only the broader indices but also S&P 1500 Health Care stocks which average a much smaller yield of just 0.5%. MDT’s dividend is comparable to the yields of some other major players within the sector like Merck (MRK) and Amgen (AMGN). One major difference, though, is that MDT has a longer history of growing its payout. MDT has also now raised its dividend every year for the past 42 years; earning it a spot amongst the Dividend Aristocrats. Although the payout ratio of 83.8% and net debt to EBITDA ratio of 1.76 have room for improvement, they do not point to any considerable concern over the company’s ability to continue this dividend growth going forward.

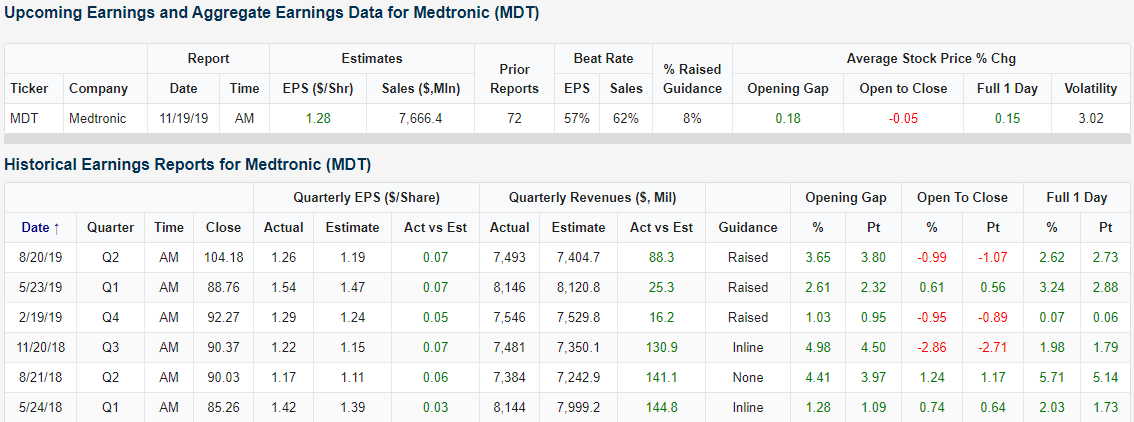
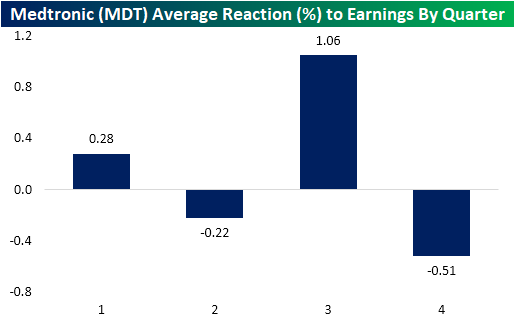
Given we are in the heart of earnings season, Medtronic’s recent earnings history has been another bright spot. Not only has the company reported a triple play in each quarter of 2019, but the stock has seen a positive full day price reaction every quarter since May of 2018 (six consecutive quarters). MDT does not report for another month, but seasonality is on the stock’s side to keep this streak going as the third quarter has historically seen the highest average full-day earnings gain, 1.06%, in response to earnings. Start a two-week free trial to Bespoke Institutional to access our interactive Earnings Explorer, 100 Most Recent Triple Plays, Trend Analyzer, and much more.
Market Cap Inequality
As technological improvements have scaled over time, there isn’t a day that goes by where we don’t see or hear about the growing problem of inequality in society. Just as technology has created an issue of haves and have-nots among individuals, it has also become increasingly evident in the stock market as well.
The chart below compares the market cap of all the companies in the small-cap Russell 2000 to the combined market cap of Apple (AAPL) and Microsoft (MSFT), the two largest US companies. Two years ago, the Russell 2000’s market cap was over a trillion more than the market cap of AAPL and MSFT. In the span of 24 months, though, the gap between the two has narrowed significantly to its current level of $114 billion, or about one PayPal (PYPL). Less than two weeks ago, the gap between the two was less than $65 billion, or roughly one Estee Lauder (EL)!
Even when we’re talking trillions, $114 billion isn’t that small of a number, and it would still take roughly a 10% gain in either Apple or Microsoft or some combination of the two (or a decline in the Russell 2000) in order to close the gap. That being said, the gap between the two has narrowed by nearly 90% in just two years. With Microsoft (MSFT) reporting after the close, a big upside surprise could help to close the gap. MSFT typically sees a move of just under 4% in reaction to earnings, and the last time it rallied 10% on earnings was four years ago back in October 2015, so it’s extremely unlikely that the gap closes in the coming days, but the fact that the spread is even this close to begin with is pretty amazing. Start a two-week free trial to Bespoke Premium to sample our most actionable investment research and receive access to all of our interactive tools. If you use this checkout link, you’ll receive a 10% discount on an annual membership if you stick with it past your trial period.

Fixed Income Weekly – 10/23/19
Searching for ways to better understand the fixed income space or looking for actionable ideas in this asset class? Bespoke’s Fixed Income Weekly provides an update on rates and credit every Wednesday. We start off with a fresh piece of analysis driven by what’s in the headlines or driving the market in a given week. We then provide charts of how US Treasury futures and rates are trading, before moving on to a summary of recent fixed income ETF performance, short-term interest rates including money market funds, and a trade idea. We summarize changes and recent developments for a variety of yield curves (UST, bund, Eurodollar, US breakeven inflation and Bespoke’s Global Yield Curve) before finishing with a review of recent UST yield curve changes, spread changes for major credit products and international bonds, and 1 year return profiles for a cross section of the fixed income world.
In this week’s report we take a look at the goings-on in the short-term interest rate markets.

Our Fixed Income Weekly helps investors stay on top of fixed income markets and gain new perspective on the developments in interest rates. You can sign up for a Bespoke research trial below to see this week’s report and everything else Bespoke publishes free for the next two weeks!
Click here and start a 14-day free trial to Bespoke Institutional to see our newest Fixed Income Weekly now!
Chart of the Day: Breakout In Brazil
B.I.G. Tips – CAT Sales Slow But Steadying
Bespoke’s Global Macro Dashboard — 10/23/19
Bespoke’s Global Macro Dashboard is a high-level summary of 22 major economies from around the world. For each country, we provide charts of local equity market prices, relative performance versus global equities, price to earnings ratios, dividend yields, economic growth, unemployment, retail sales and industrial production growth, inflation, money supply, spot FX performance versus the dollar, policy rate, and ten year local government bond yield interest rates. The report is intended as a tool for both reference and idea generation. It’s clients’ first stop for basic background info on how a given economy is performing, and what issues are driving the narrative for that economy. The dashboard helps you get up to speed on and keep track of the basics for the most important economies around the world, informing starting points for further research and risk management. It’s published weekly every Wednesday at the Bespoke Institutional membership level.
You can access our Global Macro Dashboard by starting a 14-day free trial to Bespoke Institutional now!

Bespoke’s Morning Lineup – 10/23/19
See what’s driving market performance around the world in today’s Morning Lineup. Bespoke’s Morning Lineup is the best way to start your trading day. Read it now by starting a two-week free trial to Bespoke Premium. CLICK HERE to learn more and start your free trial.

The Closer – More Brexit Drama, Rough Night for Earnings, Regional Feds Positive – 10/22/19
Log-in here if you’re a member with access to the Closer.
Looking for deeper insight on markets? In tonight’s Closer sent to Bespoke Institutional clients, we begin tonight with a summary of today’s Brexit developments and the subsequent market reaction. We then show how multiple markets including metals and small caps have been moving in lockstep with rates. Next, we review several of tonight’s earnings reports including Chipotle (CMG), Snap (SNAP), and Texas Instruments (TXN). Turning to macro data, we finish with an updated look at our Five Fed Manufacturing Composite, existing home sales, and the Bank of Canada’s Q3 business outlook surveys.

See today’s post-market Closer and everything else Bespoke publishes by starting a 14-day free trial to Bespoke Institutional today!