Jobs Growth Slows, But Only A Little Bit
Today’s job numbers beat expectations, with 196,000 jobs added and a small positive revision to the prior two months. On a rolling 3 month average, job creation fell to the lowest level in over a year, but only marginally. While jobs growth is still solid, it has cooled a bit. That isn’t anything to worry about, but it is something to keep an eye on.
Start a two-week free trial to Bespoke Premium to access our interactive research portal. You won’t be disappointed!
Wage growth picked up dramatically last year, with 2016-2018’s sideways movement in the year-over-year change of average wages paid surging. Over the last few months that growth has once again been moving sideways, albeit at a much higher rate of growth than we’ve seen for almost all of the current economic expansion.
The Bespoke Report — Second Quarter Chart Checkup
Following big market moves like we have seen in the last six months, a number of market characteristics tend to change as some new leadership groups emerge and others fall by the wayside. In order to help get a better idea of what sectors and groups have been driving the market, in this week’s Bespoke Report, we are providing a ‘chart checkup’ of all the S&P 500 Industries as well as providing updates to some key market and economic charts that we feel are important to highlight.
It was a banner week for US equities and a great encore to a strong first quarter. With the exception of the Dow (DIA), every major index ETF was up over 2%. Value outperformed growth across all three market caps, but the margin between the two was pretty narrow. Defensive sectors like Consumer Staples (XLP) and Utilities (XLU) actually saw modest declines this week, while Materials (XLB), Financials (XLF), Communication Services (XLC), and Consumer Discretionary (XLY) all rallied over 3%. In international markets, China (ASHR) surged over 7%, while Mexico (EWW) bounced over 5%. Australia (EWA) was the only country up less than 1%. Fixed income ETFs saw modest declines across the board.
This week’s report is loaded with over 95 pages of charts and tables analyzing the various market moves. To read the Bespoke Report and access everything else Bespoke’s research platform has to offer, start a two-week free trial to one of our three membership levels. You won’t be disappointed!
The Closer: End of Week Charts — 4/5/19
Looking for deeper insight on global markets and economics? In tonight’s Closer sent to Bespoke clients, we recap weekly price action in major asset classes, update economic surprise index data for major economies, chart the weekly Commitment of Traders report from the CFTC, and provide our normal nightly update on ETF performance, volume and price movers, and the Bespoke Market Timing Model. We also take a look at the trend in various developed market FX markets.
The Closer is one of our most popular reports, and you can sign up for a free trial below to see it!
See tonight’s Closer by starting a two-week free trial to Bespoke Institutional now!
Chart of the Day: Constructive Signs from DocuSign (DOCU)
Singapore Equity ETF (EWS) on Fire
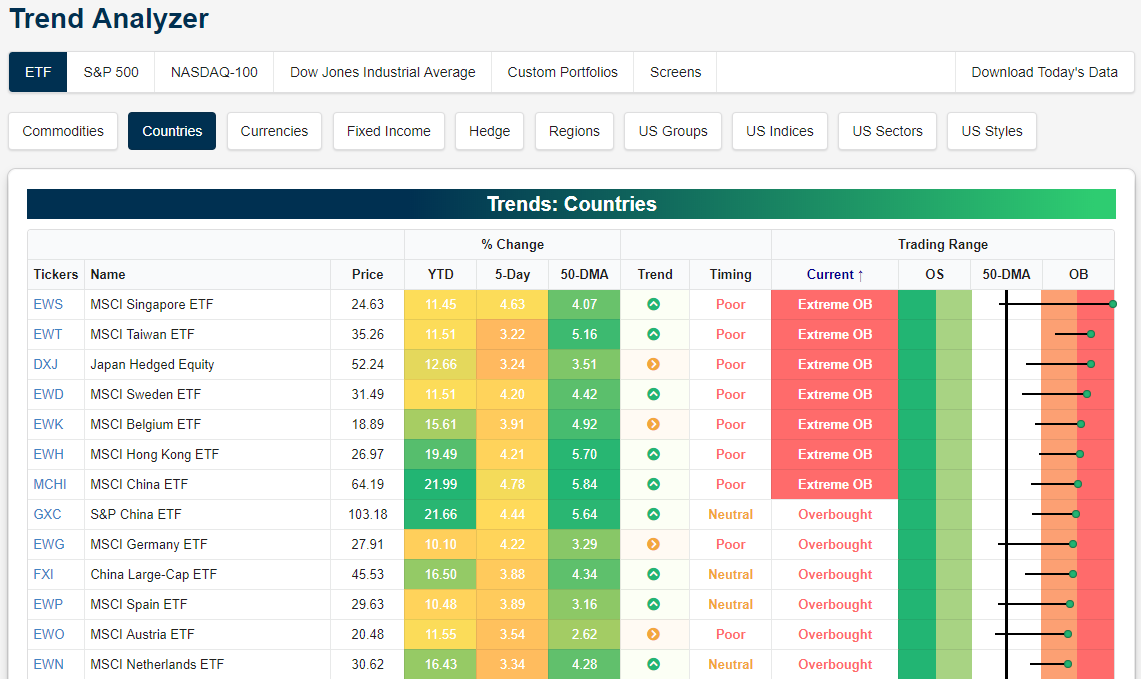
Below is a snapshot of the most overbought country stock markets right now using our Trend Analyzer tool (available to Premium and Institutional members).
As shown, there are seven countries whose markets are now in extreme overbought territory, meaning they’re more than two standard deviations above their 50-day moving averages. The Singapore equity market ETF (EWS) is the most overbought country right now as it’s three standard deviations above its 50-DMA. Other countries trading at extreme levels include Taiwan (EWT), Japan Hedged (DXJ), Sweden (EWD), Belgium (EWK), Hong Kong (EWH), and China (MCHI).
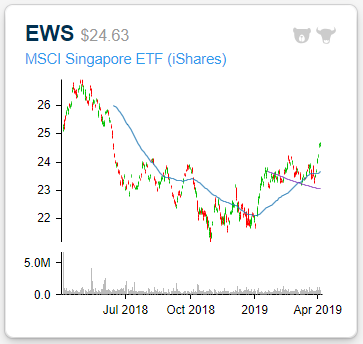
Below is a chart of the Singapore ETF pulled from our Chart Scanner tool. While the ETF is at extreme overbought levels relative to its 50-day moving average, it’s still well below its highs from 2018. And while the ETF may be due for some short-term downside mean reversion, its breakout above resistance at $24 this week should set the stage for newfound support as it trends higher. This chart looks pretty bullish in our view.
Bespoke Consumer Pulse Report — March 2019
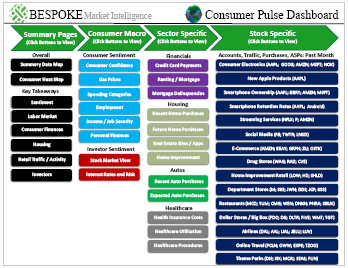
Bespoke’s Consumer Pulse Report is an analysis of a huge consumer survey that we run each month. Our goal with this survey is to track trends across the economic and financial landscape in the US. Using the results from our proprietary monthly survey, we dissect and analyze all of the data and publish the Consumer Pulse Report, which we sell access to on a subscription basis. Sign up for a 30-day free trial to our Bespoke Consumer Pulse subscription service. With a trial, you’ll get coverage of consumer electronics, social media, streaming media, retail, autos, and much more. The report also has numerous proprietary US economic data points that are extremely timely and useful for investors.
We’ve just released our most recent monthly report to Pulse subscribers, and it’s definitely worth the read if you’re curious about the health of the consumer in the current market environment. Start a 30-day free trial for a full breakdown of all of our proprietary Pulse economic indicators.
Sector Check-Up — Consumer Discretionary, Materials Now Most Overbought
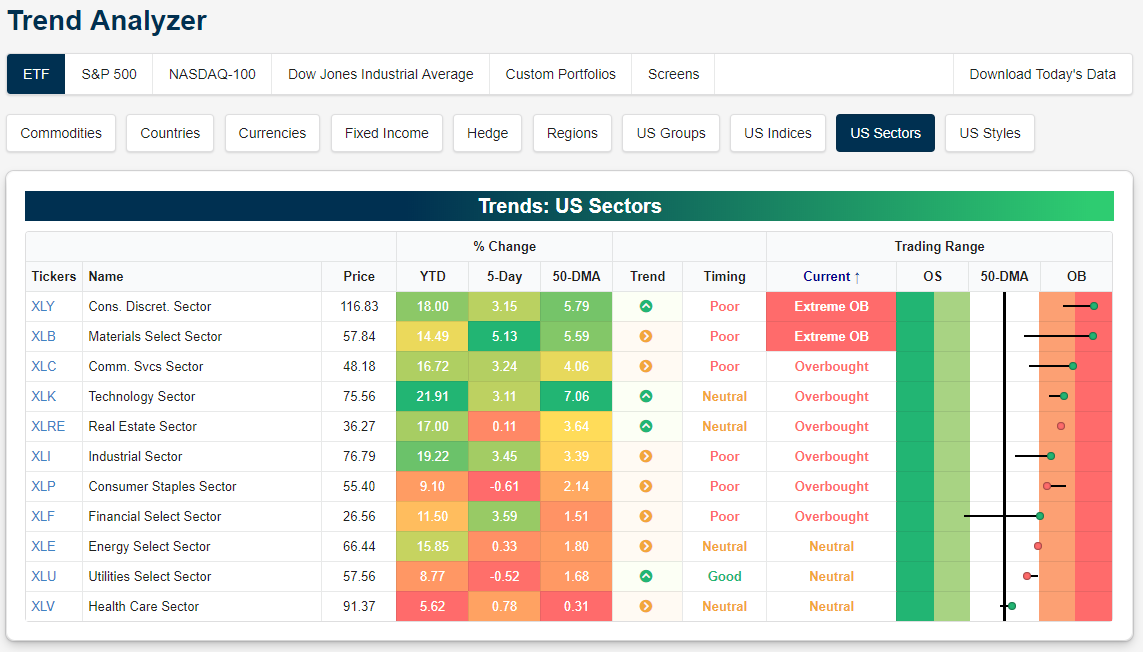
Below is a quick-and-easy way to see where US sectors are trading using our Trend Analyzer tool (available to Premium and Institutional members).
As of this morning, the two most overbought sectors were Consumer Discretionary (XLY) and Materials (XLB), which are both trading in extreme territory (more than two standard deviations above their 50-DMAs).
Every single sector is back above its 50-day moving average as of this writing, but Health Care (XLV) is barely hanging on above its 50-DMA and is lagging pretty badly.
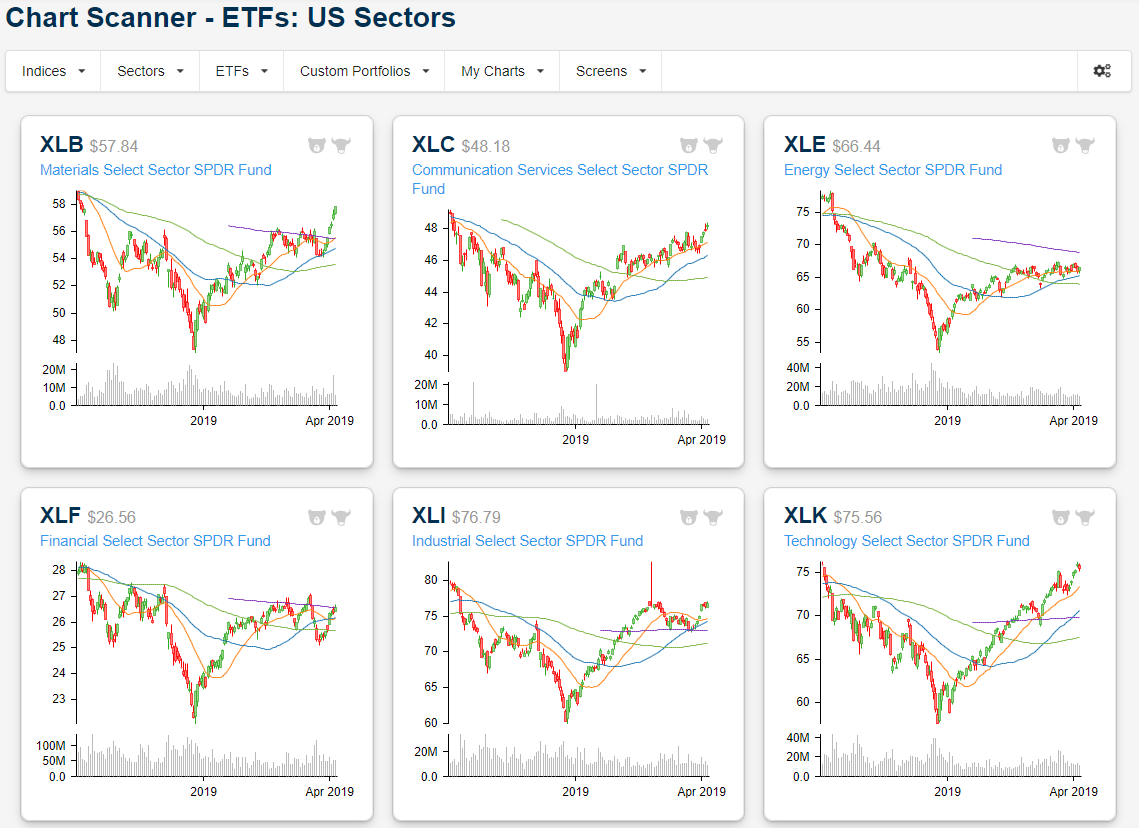
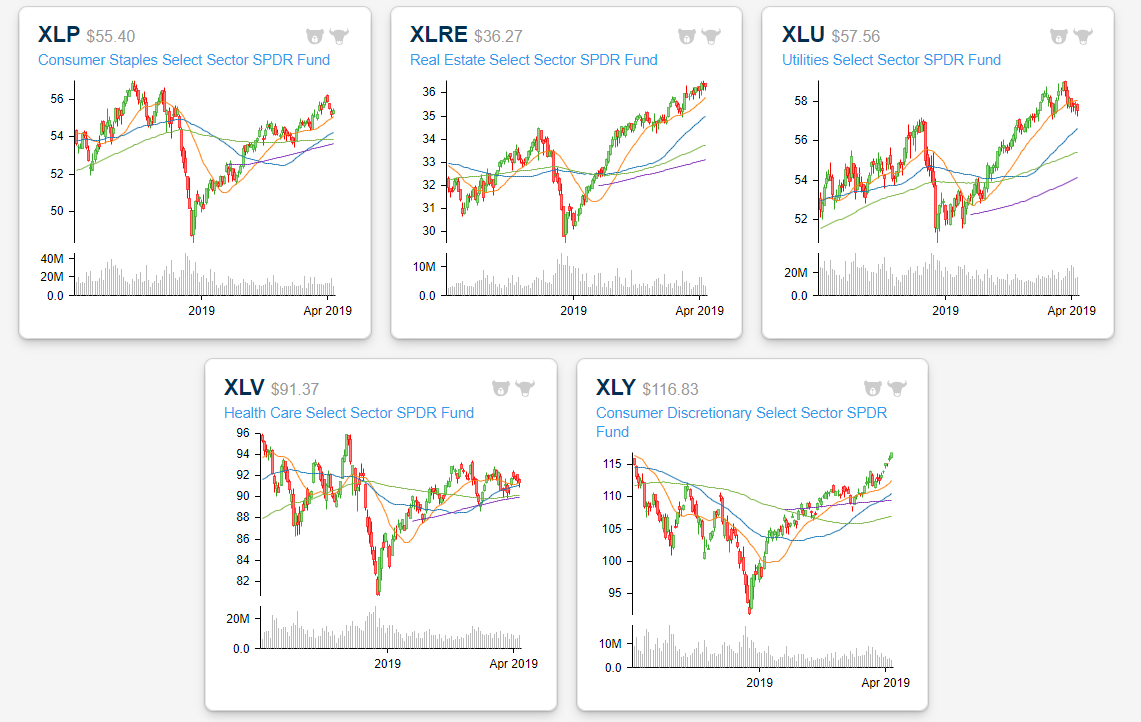
After viewing sectors in our Trend Analyzer tool, you can take a deeper dive into each one with our Chart Scanner that’s available to Institutional members. Below are screenshots of US sector ETFs from our Chart Scanner this morning. You can see that Materials (XLB) has experienced a massive breakout this week above a tight sideways range it had been in over the last month or so. The next stop for Materials will be new six-month high if it can keep up the momentum.
Consumer Discretionary (XLY) has also been rallying and now sits in extreme overbought territory. Another day of gains and Consumer Discretionary will make a 52-week high.
Start a two-week free trial to Bespoke Premium to access our interactive research portal. You won’t be disappointed!
Oil, Ag, Base Metals Overbought; Nat Gas, Precious Metals Oversold
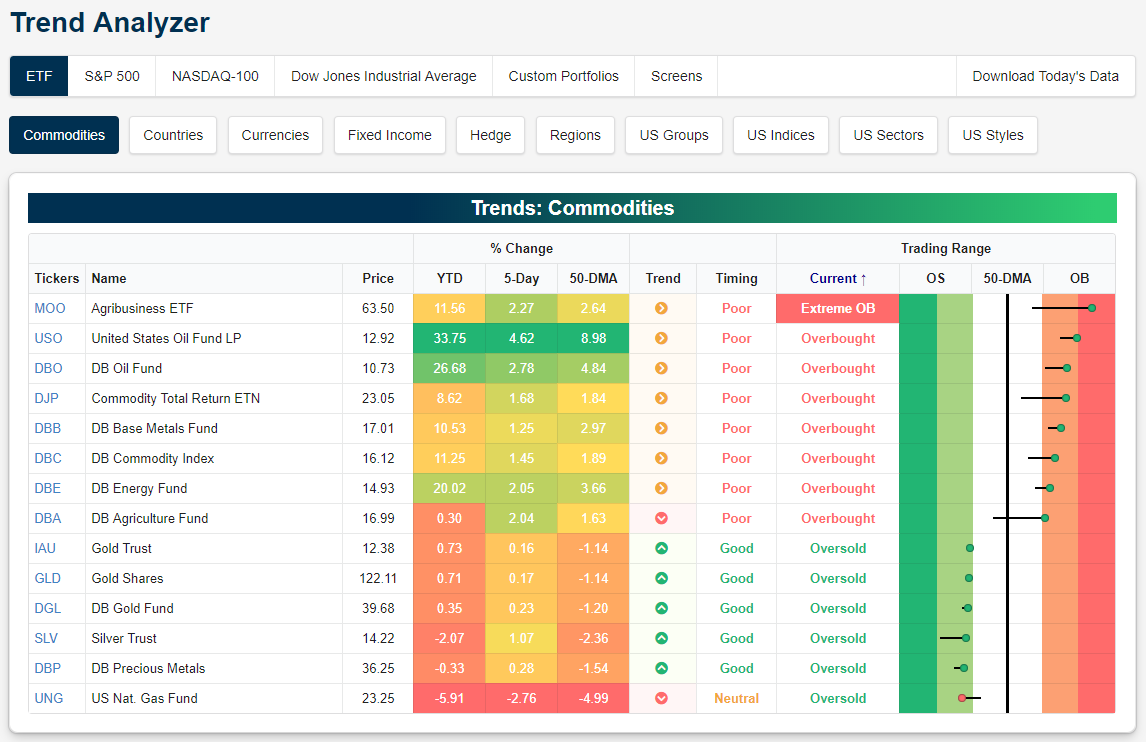
You can quickly pull up trend and timing info for commodity ETFs using our Trend Analyzer tool (available to Premium and Institutional members). Below is a snapshot from the tool as displayed this morning. Interestingly, all of the ETFs are either overbought or oversold, with none in neutral territory.
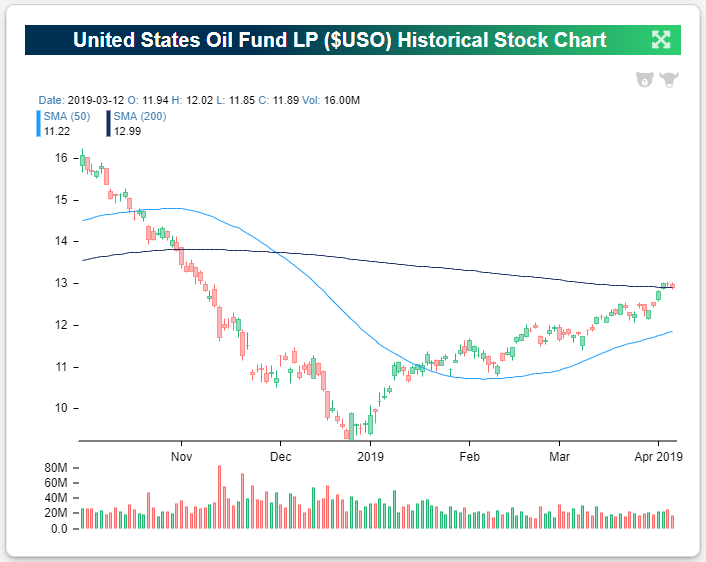
The Agribusiness ETF (MOO) is the most overbought and the only one in “extreme” territory, meaning it’s more than two standard deviations above its 50-day moving average. Next up is the United States Oil ETF (USO), which is right near extreme territory. As shown, USO is up 33.75% year-to-date and it’s 8.98% above its 50-day moving average. USO ranks first in terms of YTD performance and distance above 50-DMA compared to all other commodity ETFs.
All of the overbought commodity ETFs are related to oil, agriculture, or base metals. On the oversold side, it’s natural gas (UNG) and all of the precious metals like gold (GLD), silver (SLV), and DBP.
The oil ETF (USO) has been on a tear since it bottomed at the end of 2018. You can pull up charts for ETFs and individual stocks using our Security Analysis tool (available at the Bespoke Institutional level). Below is a quick snapshot of USO from our Security Analysis tool. The chart includes volume as well, and volume on up days is shaded green, while volume on down days is shaded red. Just this week, USO moved back above its long-term 200-day moving average. Compared to the death spiral that USO experienced last year, 2019 has been quite the opposite.
Start a two-week free trial to Bespoke Premium to access our interactive research portal. You won’t be disappointed!
Morning Lineup – Quiet Ahead of Jobs
We’ve just published today’s Morning Lineup featuring all the news and market indicators you need to know ahead of the trading day. To view the full Morning Lineup, start a two-week free trial to Bespoke Premium.
Here’s a snippet from today’s report:
Ever since it moved back out of inversion last week, the yield curve has taken a back seat in the conversation. Currently, the spread between the 10-year and 3-month US treasuries is at 12 basis points, and if you look at the chart below, you can see that it has been trying to hook higher in the last couple of days. Where it goes in the short-term, though, is likely to be guided by today’s Non-Farm Payrolls report. A much better than expected reading will likely move the curve even steeper and dismiss further concerns over inversion, while a weaker than expected print has the real potential to move us much closer back to inversion and bring those concerns back to the fore.

Start a two-week free trial to Bespoke Premium to see today’s full Morning Lineup report. You’ll receive it in your inbox each morning an hour before the open to get your trading day started.
The Closer — Tonight In Audio Form — 4/4/19
Log-in here if you’re a member with access to the Closer.
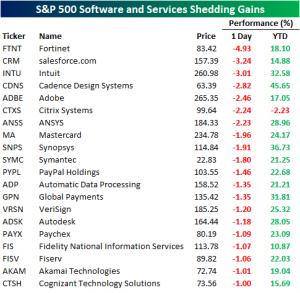
In tonight’s edition of The Closer, we are experimenting with a new format. Instead of our standard report in PDF format, we’ve compressed the report into a 10-minute audio briefing with some charts to accompany the discussion. In tonight’s briefing, we discuss economic data in Germany, Mexico, Brazil, and the US, the performance of the European auto sector, Tesla’s rising bond yields, today’s collapse in SaaS names and the outlook for the group, some Federal Reserve appointees, and a preview of economic data due out overnight as well as commentary on recent trade developments.
See today’s post-market Closer and everything else Bespoke publishes by starting a 14-day free trial to Bespoke Institutional today!

