The Bespoke Report — 4/12/19 — Dracarys!
Investors have a lot going on this weekend, whether it’s gearing up for “a tradition unlike any other” at The Masters, the final season premiere of Game of Thrones, or finishing up 2018 tax returns that are due Monday. We’ll be focused on all three!
Before taking a break for the weekend, though, there’s plenty of market-related content to get to, so sign up for a two-week free trial to one of our three membership levels and read our just-published Bespoke Report newsletter.
In this week’s report, we cover new highs for the S&P 500 total return index, the upcoming earnings reporting period, an uptick in Q1 GDP growth expectations, hot international equity markets, and more.
The Closer: End of Week Charts — 4/12/19
Looking for deeper insight on global markets and economics? In tonight’s Closer sent to Bespoke clients, we recap weekly price action in major asset classes, update economic surprise index data for major economies, chart the weekly Commitment of Traders report from the CFTC, and provide our normal nightly update on ETF performance, volume and price movers, and the Bespoke Market Timing Model. We also take a look at the trend in various developed market FX markets.
The Closer is one of our most popular reports, and you can sign up for a free trial below to see it!
See tonight’s Closer by starting a two-week free trial to Bespoke Institutional now!
Sector Charts – 4/12/19 – Communication Services
The Communication Services sector is currently one of the most overbought sectors, with the ETF (XLC) sitting over 2 standard deviations above its 50-DMA. Remember, this sector was introduced as a combination of the old Telecoms sector and some members of the Technology sector. Within the sector, several companies are setting up constructively near resistance despite the overbought levels of the index overall. Below we highlight some attractive names in the sector as well as some that are reaching pivotal points.
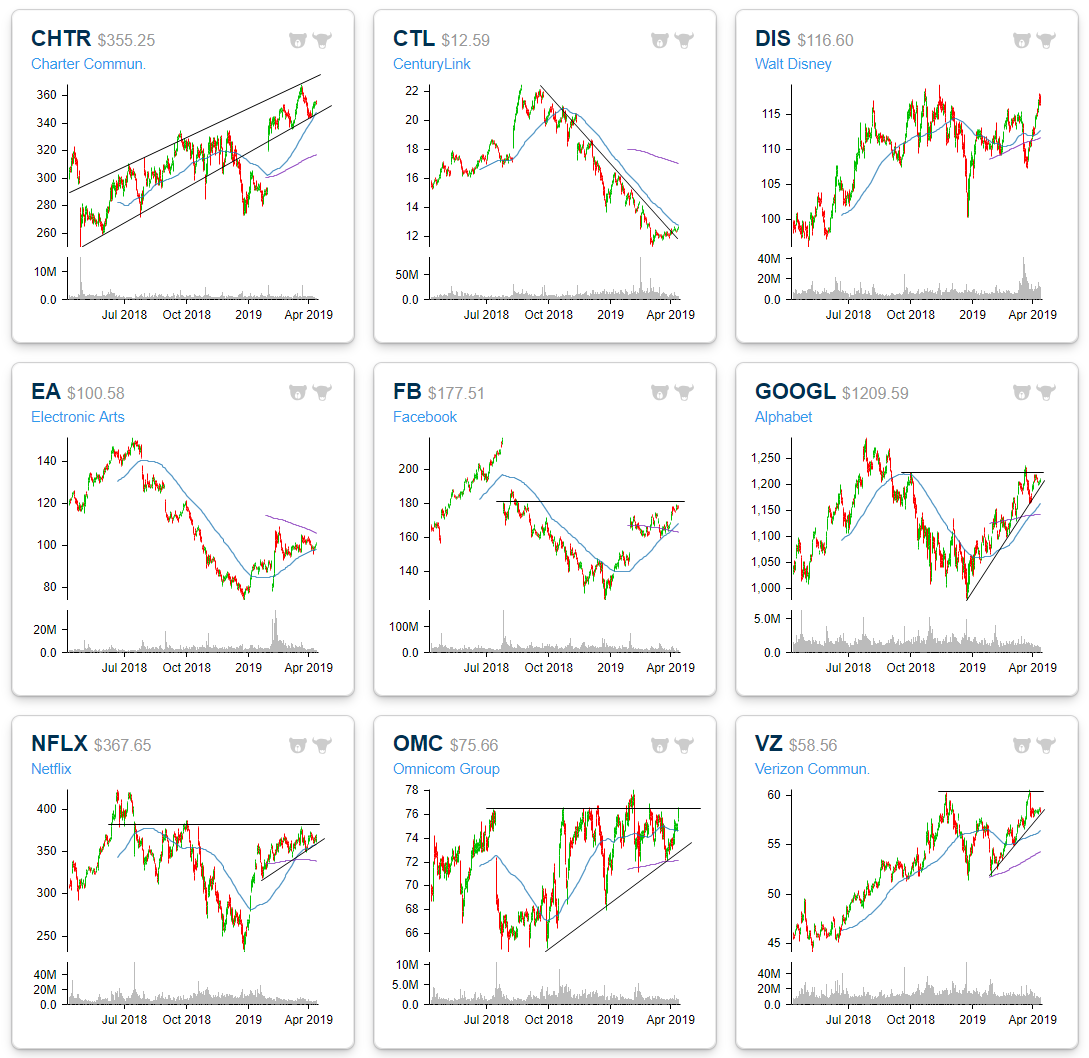
For starters, Charter Communications (CHTR) sold off hard in late 2018 after sitting in an uptrend for most of the year. After a strong earnings report in January, the stock gapped all the way back up into this uptrend channel and has continued to move within it ever since. More recently it has pulled back to find support at the bottom of this uptrend channel just above the 50-DMA and has begun to once again move higher. CHTR also has a good timing score in our Trend Analyzer tool. While CHTR’s been in a strong uptrend, CenturyLink (CTL) is looking to shake its downtrend from the past several months. After reaching highs in the late summer/early fall of last year, the stock sold off finding a bottom in early March of this year. This recent leg higher has brought it through this downtrend line, and in the past few days, right up to the 50-DMA. Granted, the stock is down big today (over 3% as of this writing) erasing the past week’s gains and failing this test of the 50-DMA. That technical development is not promising. Given that it is hard to eagerly jump on the bullish side for the stock as CTL also has had weak fundamentals for some time now. On the other hand, a rebound taking out the moving average could be sign as a bullish indicator. We would typically wait for at least a couple of “higher highs” and “lower lows” before declaring the start of a new uptrend.
Major video game publisher Electronic Arts (EA) is also seeing an interesting setup. The stock fell out of favor in 2018 but gained strength so far this year. A declining 200-DMA and rising 50-DMA have been converging with price consolidating between the two. Similarly, a move above the 200-day would be a good sign for the stock. Like CHTR, EA also has good timing in our Trend Analyzer.
Three-quarters of FANG also belong to this sector. Each one has been in a solid uptrend so far in 2019, but are now fairly overbought. Social media giant Facebook (FB) is the best example. It is one of only three stocks in the entire sector to do be more than two standard deviations above its 50-DMA. FB, NFLX, and GOOGL are also all running up to resistance from highs before the Q4 sell-off. While the overbought indicates an increased likely hood of some bias to the downside, taking out these resistance levels would certainly be a sign of health for this year’s uptrends to continue.
Omnicom (OMC) has recently bounced off of the 200-DMA and is now sitting at the upper end of the range it has traded within for the past year. At the same time, the stock has been making a series of higher lows which is a promising sign that it could finally break out of higher.
Finally, turning to Verizon (VZ), a couple of weeks ago the stock failed a test of 52-week highs. This comes after bouncing off of support just above $52. After pulling back, the stock has found support at its uptrend line and has traded along it all week. If this uptrend continues, another test of those highs could be a very promising sign.
Taken from our Chart Scanner tool, we show the charts of these stocks below.
Sign up now for a free trial and instantly unlock access to our new Interactive tools, including the Chart Scanner and Earnings Explorer!
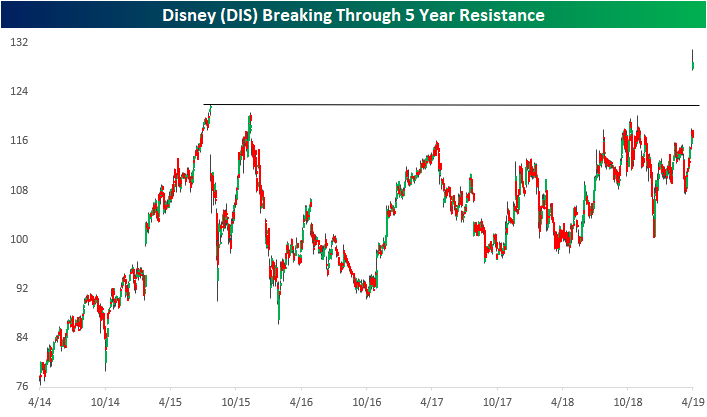
Delving into Disney (DIS), today’s surge in response to its announcement of the pricing of the company’s new streaming service has brought the stock up to an interesting level. For the past five years, DIS has been unable to retake highs near $120 set back in early August of 2015. While it has come within several dollars of these highs a couple of times in October of 2015 and 2018, the stock has more or less been stuck in a range if not a very slight uptrend in this time. Now at all time highs by a fairly wide margin, DIS will be an interesting stock to watch; and if today’s gap is to get filled at any point in the future, that prior resistance will be a critical place to watch.
Tech Sizzles
The graphic below summarizes the performance of the six different industries that comprise the Technology sector and shows each one’s weighting in the S&P 500, how the largest stocks in each industry have performed YTD, how each one has performed over various time frames, and then where each industry is currently trading with respect to its 52-week range. In each line chart on the right, the circle shows where the industry is trading now relative to its 52-week range, while the tail shows where the industry was trading as of 9/20/18 when the S&P 500 peaked.
For the Technolgy sector, performance has been on fire this year. All six of the sector’s industries are outperforming the S&P 500 YTD with gains of over 20%. MTD performance is nearly as impressive with all but two industries outperforming. So far in April, both Electronic Equipment and Semis have already seen gains of more than twice the S&P 500. In the Electronic Equipment industry, Amphenol’s (APH) 27% YTD gain has been a key driver, while in the semis Nvidia (NVDA) is up 44% YTD! The most impressive performance of them all, though, has to be Apple (AAPL). 26% may not sound like much compared to NVDA’s 44% gain, but when you are the largest company in the world, 26% translates to an increase of $131 billion in market cap!
Finally, with such big gains for the industries in the sector YTD, most of them are not only above the level they traded at when the S&P 500 peaked in September, but they are also at new highs. The only one that has yet to trade above the level it was at in September is Technology Hardware, which has been weighed down by AAPL which despite its big gain this year is still down 10% from where it was trading on 9/20. The one drawback to Tech’s recent strength, though, is as the charts below illustrate, many of these industries have become extremely extended on a short term basis, which could make them more susceptible to at least a pause in their rallies. Like what you see? Start a two-week free trial to Bespoke Premium to access our insightful market research and much more.
Morning Lineup – Good First Impression
We’ve just published today’s Morning Lineup featuring all the news and market indicators you need to know ahead of the trading day. To view the full Morning Lineup, start a two-week free trial to Bespoke Premium.
Here’s a snippet from today’s report:
The week is looking to close off on a strong note as US equity futures have been surging in the pre-market with S&P 500 futures indicated to open up by 0.70%. The drivers of this morning’s gains are a cocktail of strong loan growth data out of China, a positive start to earnings season with a big beat from JP Morgan (JPM) and no major misses from the Wells Fargo (WFC) or PNC, and then lastly a big merger in the Energy sector where Chevron (CVX) has agreed to acquire Anadarko Petroleum (APC) for $33 billion in cash and stock. Also, Disney (DIS) is trading up over 6% on its new streaming service which is expected to be unprofitable for years to come! There’s a little bit of everything for the bulls to chew on this morning.
With regards to the Energy sector, there has been some head scratching this year over the fact that the Energy sector wasn’t up more given the surge in oil prices. Today’s deal between CVX and APC would seem to validate that view. Looking at a chart of how crude oil and the Energy sector have traded over the last five years shows that the two have tended to track each other pretty closely.

If you look closely at the chart above, you can barely make out crude oil’s recent surge while the Energy sector’s rally has been more restrained. As a result of that disparity, the ratio between the price of the Energy sector to the price of WTI crude oil has fallen to 7.8, which is right near the low end of the range from the last five years and nearly two full points less than the average of 9.7. Granted, it’s a crude comparison (pun intended) and only one piece of a bigger puzzle, but based on where oil prices are trading, the Energy sector looks cheap.

Start a two-week free trial to Bespoke Premium to see today’s full Morning Lineup report. You’ll receive it in your inbox each morning an hour before the open to get your trading day started.
The Closer — Banks Around JPM, Gold, Cheap Stocks, PPI — 4/11/19
Log-in here if you’re a member with access to the Closer.
Looking for deeper insight on markets? In tonight’s Closer sent to Bespoke Institutional clients, with JPM looking to kick off earnings season tomorrow morning, we take a look at how the banking group trades around this time. Afterward, we move on to provide a technical analysis of gold. Pivoting back to equities, we show the outperformance of value year to date and offer some names that offer attractive valuations across multiple metrics and attractive chart patterns. We finish with an update of today’s PPI release which handily beat economist forecasts.
See today’s post-market Closer and everything else Bespoke publishes by starting a 14-day free trial to Bespoke Institutional today!
Bespoke’s Sector Snapshot — 4/11/19
We’ve just released our weekly Sector Snapshot report (see a sample here) for Bespoke Premium and Bespoke Institutional members. Please log-in here to view the report if you’re already a member. If you’re not yet a subscriber and would like to see the report, please start a two-week free trial to Bespoke Premium now.
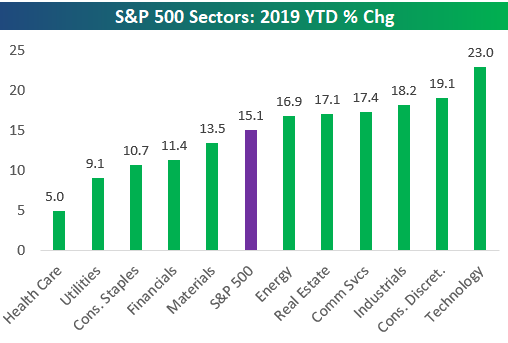
In this week’s Sector Snapshot, we highlight Tech’s ridiculous gains so far this year plus continued weakness for Health Care relative to the rest of the market.
To gain access to the report, please start a two-week free trial to our Bespoke Premium package now. Here’s a breakdown of the products you’ll receive.
Claims Bode Well For Equities
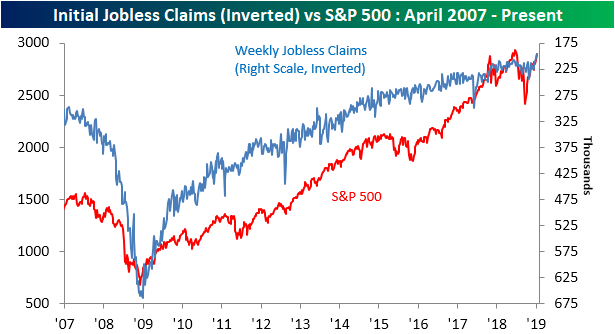
Earlier today on our Twitter account, we retweeted a chart from Bloomberg’s Joe Weisenthal of inverted Jobless Claims versus the S&P 500. We have used this chart as an argument for the bullish case for the past several years. As we mentioned in a blog post this morning, Initial Jobless Claims came in earlier this week with a sizable drop off, down to 196K versus last week’s revised 204K and expectations of 210K. This week’s print was not only a new low for the current cycle, it is also the lowest reading since 1969. That sort of new low could be a good sign for equities. As shown in the chart below, claims and the S&P have mirrored each other since bottoming following the financial crisis. (In the chart, we have inverted claims on the right axis.) As the S&P 500 inches its way back towards all time highs, so has claims towards new lows. Additionally, with recent low prints for claims bucking what had previously appeared to be an upside trend reversal, the bullish case for the S&P 500 is growing.
Start a two-week free trial to Bespoke Premium to access our interactive economic indicators monitor and much more.
Sector Charts – 4/11/19 – Technology
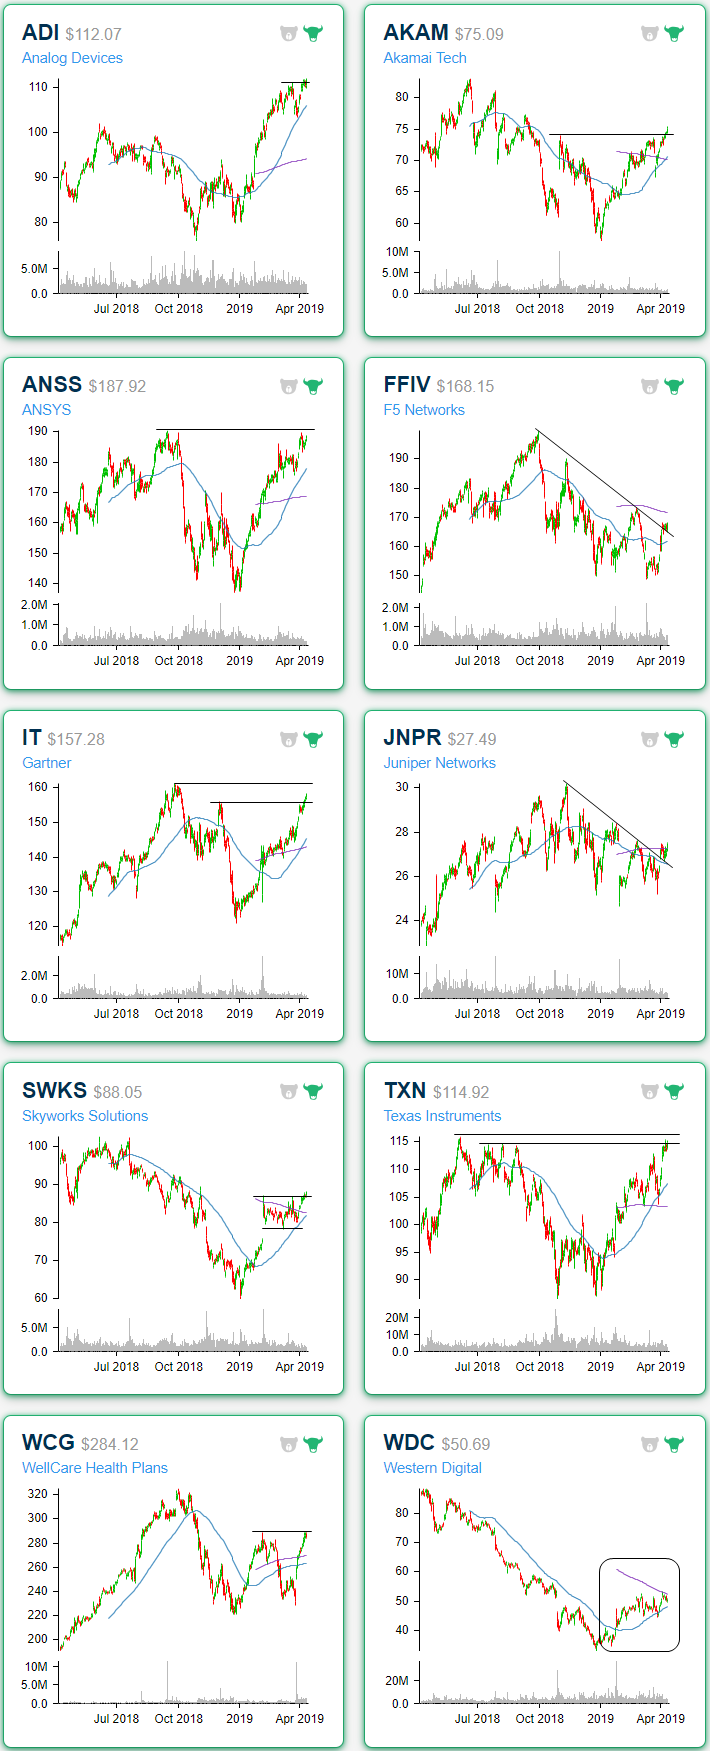
Our Chart Scanner tool offers an effective and convenient way to quickly scan through a large number of stocks and ETFs to search for potential opportunities. Panning through the S&P 500 Technology Sector, there are a number of attractive chart patterns forming. Starting with Analog Devices (ADI), the stock has been on a tear this year rising from just barely over $80 in the first days of January all the way up to $112.55 today; around a 30% gain. At its current levels, the stock is eying a breakout following a pullback and a nice bounce off of the 50-DMA. Going forward, that moving average is likely to continue to act as support. Similarly, Akamai Tech (AKAM) is breaking out above prior highs established during the late 2018 sell off after it too found support at the 50-DMA.
While most stocks have long broken out of their downtrends that had begun in late 2018, two stocks — Juniper Networks (JNPR) and F5 Networks (FFIV) — have more or less been holding onto those trends for dear life. These two have been unable to press above their downtrend lines up until recently when they not only managed to break out but also came back to bounce off of these downtrend lines. JNPR also managed to take out the 200-DMA in the process.
Staying on the topic of moving averages, Western Digital (WDC) is seeing some interesting trading bouncing between its upward sloping 50-DMA and downward sloping 200-DMA. In the past few days, the stock has made a higher low near the upper end of this shrinking range, and a close above the 200-DMA would certainly be a positive sign of a move out of this consolidation.
While WDC is looking to make its final push up to resistance, there are four other stocks that are in interesting positions in regards to resistance. A few, like ANSYS (ANSS), Gartner (IT), and Texas Instruments (TXN) have already taken out initial resistance in what has been a strong rally this year. Looking forward for these three, the next levels to watch are their 52-week highs. For ANSS, this will actually be the third time the stock has come up to test these levels around $190. Others are still some distance away from 52-week highs like Skyworks Solutions (SWKS). SWKS is currently breaking out of consolidation to the upside with the next resistance to watch around $89.50.
Sign up now for a free trial and instantly unlock access to our new Interactive tools, including the Chart Scanner and Earnings Explorer!
Netflix Buffers Ahead of Disney Streaming Event
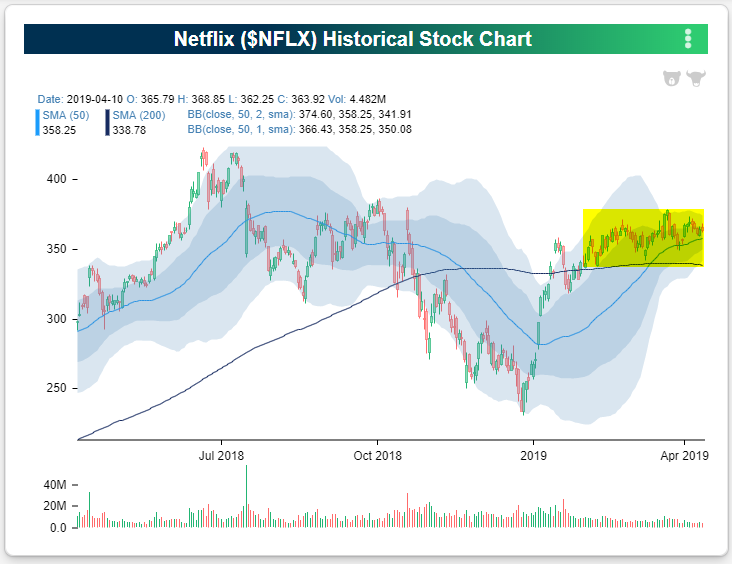
After surging off the December lows, Netflix (NFLX) has done its best impression of a show buffering with a slow internet connection – the stock has gone nowhere. The chart below is from our new and improved Chart Scanner tool, and as shown in the highlighted area, the stock has been trading in an extremely tight range relative to its normal trading pattern. Maybe the stock is just consolidating after its big move, or perhaps investors have been taking a wait and see approach ahead of Apple’s streaming announcement late last month and Disney’s (DIS) Investor Day on Thursday (4/11) where the company is slated to unveil its streaming plans. Sign up now for a free trial and instantly unlock access to our new Interactive tools, including the Chart Scanner and Earnings Explorer!
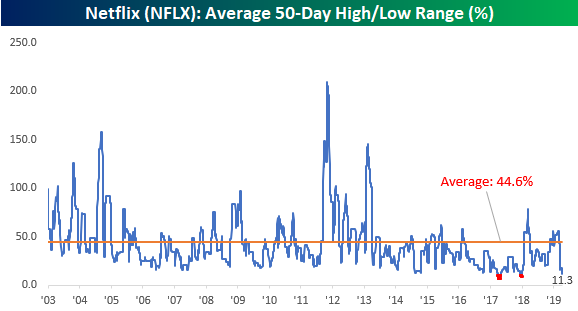
Whatever the cause of the pause, Netflix’s range over the last 50-trading days is near historic lows. With a high/low range (based on closing prices) of 11.3%, the stock’s trading range over the last 50 trading days is just one-quarter of its historical average and narrower than every other period in the stock’s history except two.
Those two periods where the stock traded in a narrower range were in early and late 2017 when the 50-day range briefly dropped below 10%. In the chart below, we show where those two prior periods occurred with respect to Netflix’s stock price since the start of 2016. For what it’s worth, in both periods where the stock finally moved out of that narrow range, the move was to the upside.


