Bespoke CNBC Appearance (11/8/19)
Bespoke co-founder Paul Hickey appeared on CNBC’s Closing Bell to discuss the recent outperformance of value versus growth. To view the segment, click on the image below. Sign up for Bespoke’s “2020” special and get our upcoming Bespoke Report 2020 Market Outlook and Investor Toolkit.

October 2019 Headlines
Chinese Stocks Showing Signs of Life
While US and Chinese trade talks are a constant in the news, you don’t really hear much about Chinese equities these days. While the Shanghai Composite Index got off to a blistering start in 2019, it gave up a good share of those gains in the Spring and has traded in a very tight range ever since even as global stocks break out. For a typically volatile index like the Shanghai Composite, the 9.9% range it has traded in over the last six months is relatively narrow. Since 1990, there have only been three other periods where the index’s six-month trading range was in the single-digits.

While the Shanghai Composite index has been lacking in vitality, smaller-cap Chinese stocks have been showing signs of life. The chart below shows the performance of the Chinese ChiNext Index, which is a segment of the Shenzhen stock exchange that is composed of smaller cap Chinese companies. Companies in this index face less stringent listing requirements and are often considered to be earlier in their corporate life-cycle than more established companies. In simple terms, the ChiNext index is often referred to as the Nasdaq of China.
Like the Shanghai Composite Index, the ChiNext Index had a strong start to 2019 but quickly gave up most of its early gains. Unlike the Shanghai Composite Index, though, the ChiNext index has recouped much of its losses from the Spring and is now just 4.5% below its 2019 high compared to the Shanghai Composite Index which is still down just under 10% from its YTD high. If the ChiNext can take out both its recent high from August and the highs from earlier in the year, Chinese equities, in general, will likely follow suit. Sign up for Bespoke’s “2020” special and get our upcoming Bespoke Report 2020 Market Outlook and Investor Toolkit.

Bespoke’s Morning Lineup – 11/8/19 – Curve Ball
See what’s driving market performance around the world in today’s Morning Lineup. Bespoke’s Morning Lineup is the best way to start your trading day. Read it now by starting a two-week free trial to Bespoke Premium. CLICK HERE to learn more and start your free trial.

The Closer – What To Buy When Yields Fly; What To Sell When Curves Fall – 11/7/19
Log-in here if you’re a member with access to the Closer.
Looking for deeper insight on markets? In tonight’s Closer sent to Bespoke Institutional clients, as risk sentiment has improved, yields have soared. We begin with a look at some of the stocks with the highest and lowest correlations to the 10-year yield. Given this we also show the deteriorating technical picture of Treasury futures. On the bright side, we then review some more bullish charts of international equities including CWI, EEM, and ASHR. We finish tonight with an update to Bloomberg’s weekly data on Consumer Comfort which has dropped substantially in the past two weeks.

See today’s post-market Closer and everything else Bespoke publishes by starting a 14-day free trial to Bespoke Institutional today!
S&P 500 Price vs 50-DMA
The S&P 500 has been on a seemingly uninterrupted run higher over the last several days, but by some measures, it may not be as extended as you would think. The chart below shows the historical percentage spread between the S&P 500 and its 50-day moving average (DMA) over the last three years. Through Thursday’s close, the S&P 500 was 3.2% above its 50-DMA, which is relatively high but nowhere near an extreme. The red line in the chart below shows the current percentage spread between the S&P 500’s price and its 50-DMA. There have been a number of times since the 2016 election where this spread was higher with the most recent being back in July. In fact, 17% of all prior days in the last three years have seen the S&P 500 close at a higher level relative to its 50-DMA than it is now. That doesn’t mean the market isn’t overbought, but it’s not exactly at unprecedented levels either. Sign up for Bespoke’s “2020” special and get our upcoming Bespoke Report 2020 Market Outlook and Investor Toolkit.

Bespoke’s Sector Snapshot — 11/7/19
Bespoke S&P 500 Sector Weightings Report — November 2019
S&P 500 sector weightings are important to monitor. Over the years when weightings have gotten extremely lopsided for one or two sectors, it hasn’t ended well. Below is a table showing S&P 500 sector weightings from the mid-1990s through 2016. In the early 1990s before the Dot Com bubble, the US economy was much more evenly weighted between manufacturing sectors and service sectors. Sector weightings were bunched together between 6% and 14% across the board. In 1990, Tech was tied for the smallest sector of the market at 6.3%, while Industrials was the largest at 14.7%. The spread between the largest and smallest sectors back then was just over 8 percentage points.
The Dot Com bubble completely blew up the balanced economy, and looking back you can clearly see how lopsided things had become. Once the Tech bubble burst, it was the Financial sector that began its charge towards dominance. The Financial sector’s sole purpose is to service the economy, so in our view you never want to see the Financial sector make up the largest portion of the economy. That was the case from 2002 to 2007, though, and we all know how that ended.
Unfortunately we’ve begun to see sector weightings get extremely out of whack once again.
If you would like to see the most up-to-date numbers for S&P 500 sector weightings, simply start a two-week free trial to our Bespoke Premium or Bespoke Institutional services. Click back to this post to see the numbers once you’re signed up!

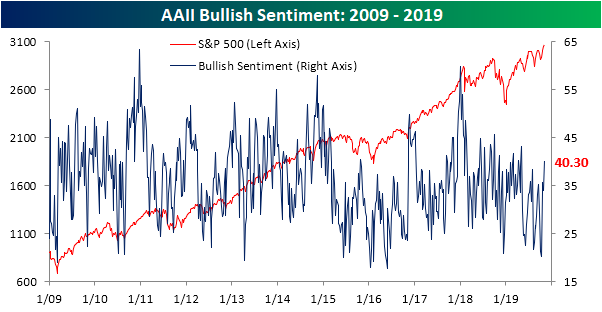
Sentiment Sharply Rebounds
Fresh all-time highs in the major indices have finally boosted investor confidence as per AAII data. Rising to 40.3% from 33.98% last week, the percentage of bullish investors rose to the highest level since early May when it was 43.13%. The past four weeks have seen bullish sentiment surge by just under 20 percentage points off of the low of 20.31% in early October. The last time that optimism has risen as rapidly in a four week span was from December of 2017 to January of 2018 when it rose 22.9 percentage points. At that time, sentiment reached much more extreme levels, topping out at 59.75%.
Bullish sentiment has also moved back above its historical average of 38.08% for the first time since August 1st. For most of this year, bullish sentiment has remained fairly subdued. With only a couple of months left in the year, only 9 weeks in 2019 have seen bullish sentiment readings above the historical average. In the history of the survey, only 2016, 1988, and 1987 saw fewer weeks with above average bullish readings.
Given the bullish surge, bearishness has unwinded. After reaching its recent high of 44% last month, bearish sentiment has fallen all the way down to 23.93%. That is the lowest reading since May. As with bullish sentiment, the move over the past four weeks has been substantial. In fact, the 20.03 percentage point decline is the largest since March of 2016 when bearishness dropped 24.32 percentage points.

Bulls not only took from bears this week, but neutral sentiment also fell down to 35.77%. Unlike bullish and bearish sentiment, that move was much smaller at only 1.82 percentage points as neutral sentiment is now right back to similar levels as last month. Start a two-week free trial to Bespoke Institutional to access our interactive economic indicators monitor and much more.
