B.I.G. Tips – Q3 2019 Earnings Season Review; Top Triple Plays
Sluggish Manufacturing in the New York Region
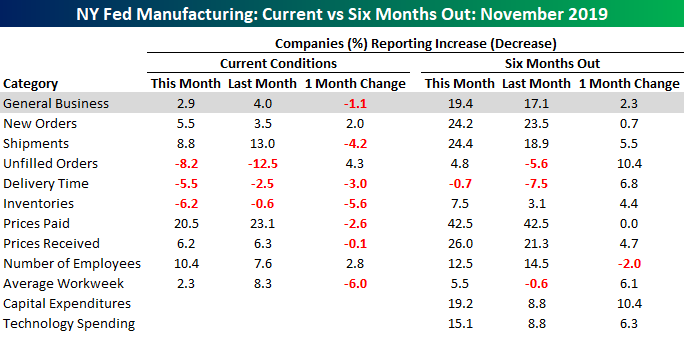
This morning saw one of the first looks at November activity with the NY Fed Empire Manufacturing report. Economists weren’t expecting much of a strong report to begin with as the consensus forecast for the headline General Business Conditions index was for a reading of 6.0 vs last month’s reading of 4.0. The actual reading actually showed a slight decline from last month, though, falling to 2.9. While the current conditions index declined, expectations actually saw a small boost rising from 17.1 up to 19.4.
One interesting thing to note is how little Empire Manufacturing has changed in recent months. With monthly readings of 4.3, 4.8, 2.0, 4.0, and now 2.9, the index has had a five-month range of just 2.8 points. In the history of the survey dating back to 2001, the only five-month window with a narrower range was in late 2011!

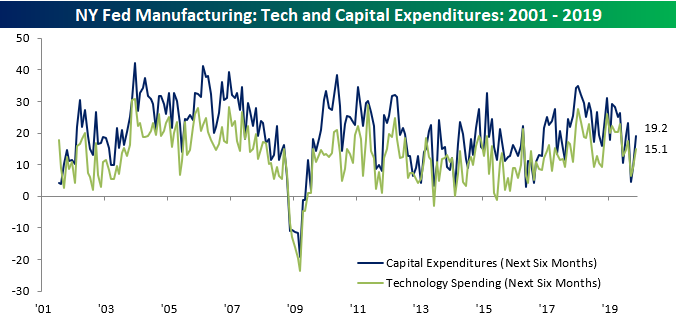
In terms of plans for Capital Expenditures and Technology Spending over the next six months, it was encouraging to see both of these readings rebound after falling sharply in recent months.
Finally, the table below shows the month/month change for each category of the Empire Manufacturing report in terms of both current conditions and expectations. What’s interesting to note about this month’s data is that while there was broad-based weakness in terms of current conditions, expectations rebounded, suggesting that manufacturers are expecting an upturn from current conditions. Sign up for Bespoke’s “2020” special and get our upcoming Bespoke Report 2020 Market Outlook and Investor Toolkit.
B.I.G. Tips – Retail Sales Rebound
Bespoke’s Morning Lineup – 11/15/19 – Retail Sales Friday
See what’s driving market performance around the world in today’s Morning Lineup. Bespoke’s Morning Lineup is the best way to start your trading day. Read it now by starting a two-week free trial to Bespoke Premium. CLICK HERE to learn more and start your free trial.

The Closer – Wal-Mart Reversal, Volatile Fed, Transportation, Iron, Fund Flows – 11/14/19
Log-in here if you’re a member with access to the Closer.
Looking for deeper insight on markets? In tonight’s Closer sent to Bespoke Institutional clients, we begin with a look at what Wal-Mart’s (WMT) intraday reversal means for the stock as well as how consumer staples and other defensives have lagged recently. Next, we look into the relationship between the Fed’s balance sheet and volatility before moving onto today’s economic data including freight volumes, EIA data, and ICI Fund Flows.

See today’s post-market Closer and everything else Bespoke publishes by starting a 14-day free trial to Bespoke Institutional today!
Bespoke’s Sector Snapshot — 11/14/19
Cisco (CSCO) Deja Vu
Call it deja vu, but Cisco (CSCO) is seeing a repeat of its August earnings report. Back in the summer, CSCO beat on the top and bottom line but lowered guidance leading the stock to fall 8.61% the following day. Fast-forwarding to today, CSCO reported after yesterday’s close with the same results. The company once again lowered guidance while beating EPS by 3 cents and revenues by $69.4 million. Although the stock’s performance in response has not been quite as bad as last time around, CSCO fell over 7% on Thursday. That is the worst single-day performance for the stock since its last earnings report. Two quarters in a row now, CSCO has fallen substantially on earnings. That is quite the difference from the previous four quarters when the stock rose each time.
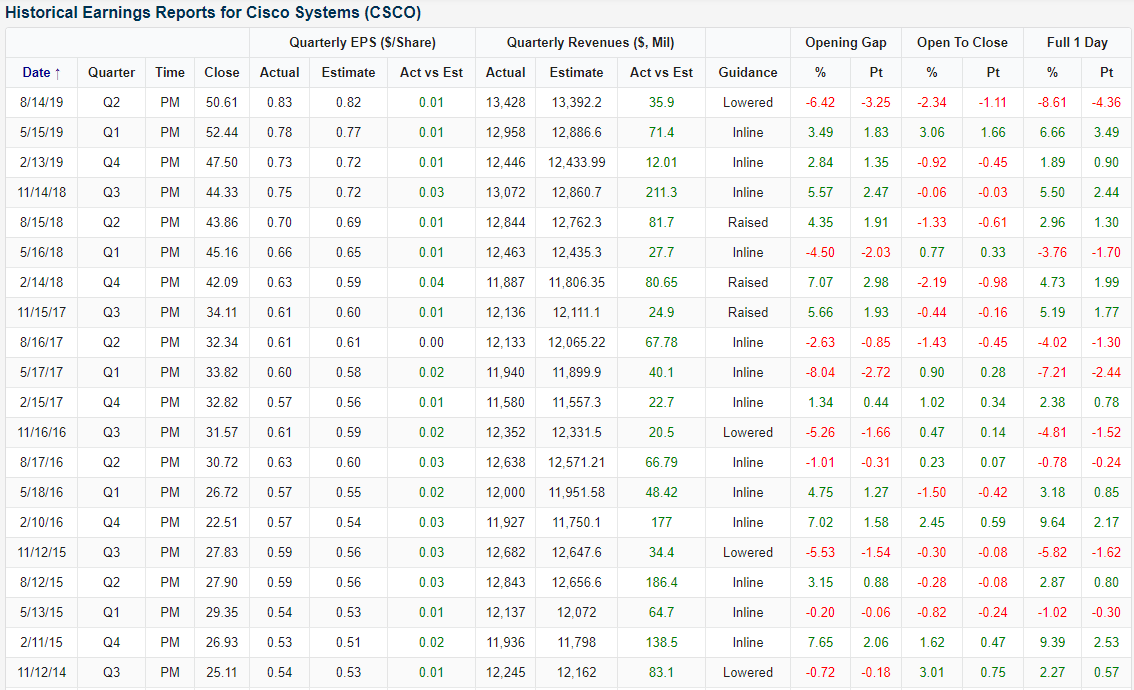
Last Monday, we highlighted Cisco (CSCO) in a Dividend Stock Spotlight noting that although it has an attractive dividend, the technical picture was mixed with the stock at a bit of a crossroads at the bottom of a longer-term uptrend thanks to a rough-looking shorter term. The past few months’ declines have come following the aforementioned earnings report in August and a weak quarter from competitor Arista Networks (ANET) further dampening the outlook for CSCO. These catalysts since the summer in conjunction with today’s declines have brought the stock under support between $45-46 and also broken the longer-term uptrend that had been in place over the past few years. Since it’s high on July 15th, CSCO has declines more than 22% and shed $42.8 billion in market cap. To put that into perspective, that decline is within $1 bn of the current market caps of Advanced Micro Devices (AMD), Humana (HUM), Progressive (PGR), and Marriott Hotels (MAR). Start a two-week free trial to Bespoke Institutional to gain full access to our research and interactive tools.

Shrinking Ranges
In the S&P 500’s run to new highs over the last few weeks, overall volatility has really become subdued. For example, the S&P 500 hasn’t had an intraday swing of even 1% in more than a month now. The chart below shows streaks over the last ten years where the S&P 500 didn’t see a 1% spread between its intraday high and low and allows us to compare how the current streak stacks up to prior periods.
While the current 24 trading day streak without a 1% intraday move is far from the longest over the last ten years, there haven’t been a lot of streaks that were longer. Ironically enough, the three streaks that were the longest of the last ten years all occurred in the two years after the 2016 election. For all the turmoil that seems to surround this Administration, market turmoil hasn’t been one of them. Sign up for Bespoke’s “2020” special and get our upcoming Bespoke Report 2020 Market Outlook and Investor Toolkit.

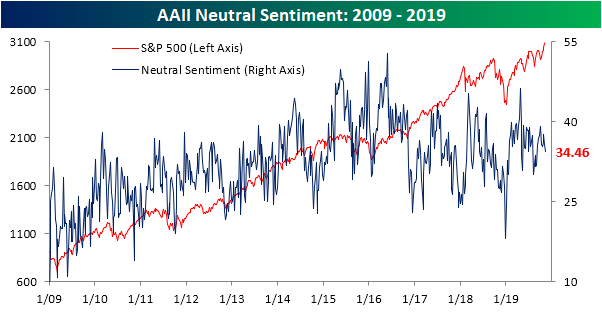
Sentiment Stays the Same
Despite a couple closes at all-time highs in the past week, the S&P 500 is currently right around the same levels as last Wednesday’s close. With little in the way of price changes, sentiment has likewise seen little change. Per AAII’s weekly survey, bullish sentiment rose just 0.42 percentage points to 40.72% from 40.30% last week. That small increase is in the bottom 5% of all week-over-week changes in bullish sentiment in the history of the data.
While little changed, the bulk of investors are still optimistic. Another sentiment survey from Investors Intelligence also echoed these results. In that survey released yesterday, 57.6% reported as bullish. While that is the highest reading since July, it is up only around half of one percent from last week.

Bearish sentiment was also little changed. The percentage of investors reporting as pessimistic rose 0.89 percentage points to 24.82%. Like bullish sentiment, the one week change in bearish sentiment was small relative to history with this week’s change sitting in the 7th percentile of all readings. This week also marked the fourth in a row that bearish sentiment has been below its historical average. That is the longest such streak since a seven-week run from the end of March to early May of this year.

Neutral sentiment moved the most this week falling 1.31 percentage points. Now at 34.46%, neutral sentiment is the lowest since early September and back in the middle of the past few years’ range. Start a two-week free trial to Bespoke Institutional to access our interactive economic indicators monitor and much more.