Bespoke’s Morning Lineup – 12/31/19 – Just Shy of the Top Ten
See what’s driving market performance around the world in today’s Morning Lineup. Bespoke’s Morning Lineup is the best way to start your trading day. Read it now by starting a two-week free trial to Bespoke Premium. CLICK HERE to learn more and start your free trial.

The Closer – Mean Reversion, Year-End Rotation, GDP, Manufacturing- 12/30/19
Log-in here if you’re a member with access to the Closer.
Looking for deeper insight on markets? In tonight’s Closer sent to Bespoke Institutional clients, we show how the recent pullback in equities has been a function of mean reversion and year-end rotation before reviewing today’s economic data including the trade balance, inventories, and our Five Fed Manufacturing Index.

See today’s post-market Closer and everything else Bespoke publishes by starting a 14-day free trial to Bespoke Institutional today!
Am I Diversified?
One of the primary drivers of the boom in ETFs over the last decade is that they provide efficient diversification to the market and various sectors/groups. While that’s the theory, the reality is that a number of the biggest sector ETF’s aren’t all that diversified at all. The chart below shows the weight of the top two holdings in each of the 11 S&P 500 sector ETFs. Would you believe that the two largest holdings in two ETFs account for more than 40% of the entire ETF, while in the ETFs for another two sectors the largest two components account for more than a third of the entire ETF? That’s right, in the Energy sector, the top two holdings (Exxon and Chevron) account for just under 43% of the entire ETF, while Alphabet (GOOGL) and Facebook (FB) account for 41.8% of the new Communications Services sector ETF (XLC). In the Tech sector, Apple (AAPL) and Microsoft (MSFT) account for just under 40% of the XLK ETF.

The table below lists each of the eleven sector ETFs along with their top two holdings. As noted, in the case of companies with dual-listed share classes in the ETF, we include both share classes as one. In the case of three sectors (Communication Services, Consumer Discretionary, and Energy), the top holding accounts for over 20% of the entire ETF. Normally, when you think about diversification, you would picture spreading out your bets across a variety of different companies so that you aren’t too exposed to any one name. However, when one out of every five dollars invested goes to one stock, we aren’t sure how diversified that really is. Now, the purpose of highlighting these top-heavy ETFs is in no way meant to imply that these ETFs are faulty in their construction. In fact, these ETFs do a very good job of tracking the sectors they are intended to track. Instead, it is an illustration of just how top-heavy the major indices have become. Investing in “the market” or a specific sector is increasingly becoming a concentrated bet on a number of large names. Start a two-week free trial to Bespoke Institutional to access our Trend Analyzer tool and track key trends in individual stocks and major ETFs.

Dividend Stock Spotlight: Intel (INTC)
Intel (INTC) surged in the first quarter of 2019, but after lowering guidance in its April earnings report, the stock fell 9% the following day with further declines from there. Within a month of its earnings report, the stock had fully erased its YTD gains. INTC bottomed in late May and has been in an uptrend ever since. Along the way, the stock saw an 8.1% pop in response to an earnings triple play and took out resistance around $52.5 in the process. That was not the only notable resistance that has been taken out though. After filling the gap from its April decline, INTC was stuck below its spring highs throughout the fall, but in the past week it has broken out once again. While the stock is pulling back today, and could potentially retest this former resistance level, the current set up for INTC looks attractive.
Valuations for the tech sector have broadly become elevated, especially for INTC’s biggest competitor Advanced Mirco Devices (AMD) which trades at around 200 times earnings, but INTC is one of the more reasonably valued amongst its peers. INTC has the eighth-lowest trailing price-earnings ratio, 13.98, of the 70 stocks in the S&P 500 Technology sector and its price-sales and price-book ratios are likewise well below the sector average. Additionally, while not the highest yielder in the sector, INTC’s dividend yield is also on the higher side at 2.1% compared to just 1.29% for the sector and 1.82% for the S&P 500. Start a two-week free trial to Bespoke Institutional to access our interactive economic indicators monitor and much more.

Chart of the Day: After Hours vs. Intraday by Weekday
Bespoke’s Morning Lineup – 12/30/19 – Just 13 Hours Left
See what’s driving market performance around the world in today’s Morning Lineup. Bespoke’s Morning Lineup is the best way to start your trading day. Read it now by starting a two-week free trial to Bespoke Premium. CLICK HERE to learn more and start your free trial.
Bespoke Brunch Reads: 12/29/19
Welcome to Bespoke Brunch Reads — a linkfest of the favorite things we read over the past week. The links are mostly market related, but there are some other interesting subjects covered as well. We hope you enjoy the food for thought as a supplement to the research we provide you during the week.
While you’re here, join Bespoke Premium for 3 months for just $95 with our 2020 Annual Outlook special offer.
Investors
From zero to $150 billion: The inside story of Jeffrey Gundlach’s decade at DoubleLine by Julia La Roche (Yahoo!)
The so-called “bond king”, fixed income investor Jeffrey Gundlach, has taken DoubleLine from nothing to $150bn AUM over the past decade. [Link; auto-playing video]
Master Stockpicker Peter Lynch: If You Only Invest in an Index, You’ll Never Beat It by Leslie P. Norton (Barron’s)
A discussion of what has changed – and what hasn’t – since one of the most successful mutual fund managers in history called it quits. [Link; paywall]
Tech Dystopia
Brain-reading tech is coming. The law is not ready to protect us. by Sigal Samuel (Vox)
As is often the case with new technologies, techniques that may be able to connect humans’ brains directly to computers offer a series of new legal problems. [Link]
Philip K. Dick and the Fake Humans by Henry Farrell (Boston Review)
While Huxley (Brave New World) and Orwell (1984) get the most credit for dystopian predictions (including in the previous link), the real visionary was the work of Philip K. Dick, who conceptualized a world where telling apart humans and software would become increasingly difficult. [Link]
Flying Cars, Hyperloops and the Other 2020 Tech Predictions That Didn’t Pan Out by Mark Milian (Yahoo!/Bloomberg)
A long list of futuristic predictions that just didn’t pan out, part of the Panglossian decade of tech that simply didn’t deliver on what was promised by its promoters. [Link]
Cars
‘They Go Absolutely Insane and Tear Everything Apart’: Weasels Love German Cars by William Boston (WSJ)
German drivers filed claims for almost 200,000 instances of weasel-related incidents, part of a national war between drivers and stone martens. [Link; paywall]
GM requests green light to ditch steering wheel in its self-driving cars by Trevor Mogg (Digital Trends)
The self-driving car unit of GM, Cruise, has entered talks with GM to launch a self-driving vehicle that does not have a steering wheel at all, a first. [Link]
36 Corvettes, Hidden for Years in a Garage, Will Be Given Away by James Barron (NYT)
A VH1 contest in 1989 delivered 36 Corvettes to a lucky winner, who almost immediately sold them. The collection has been kept together, though, and is now being raffled off in support of the National Guard Educational Foundation. [Link; soft paywall]
Uniquely New York
The New York metro area has the lowest rate of population turnover in the US by Dan Kopf (Quartz)
A smaller percentage of New Yorkers either arrived from elsewhere or left the city than any other metro area in the country per US Census data. [Link]
The Rikers Coffee Academy by Amy Chozick (NYT)
Teaching inmates to whip up espressos and lattes is part of a program at Rikers that is designed to connect inmates to a job when they finish serving their sentence. [Link; soft paywall]
Politics
Trump stock market rally is far outpacing past US presidents by Maggie Fitzgerald (CNBC)
A write-up of Bespoke’s own analyses related to the historical performance of the stock market relative to the broader political cycle. [Link]
Millionaires support a wealth tax — as long as they aren’t getting taxed: CNBC survey by Robert Frank (CNBC)
A CNBC survey of millionaires showed that support for taxing relatively wealthier millionaires was high, but relatively few millionaires wanted to pay a tax themselves. [Link]
Central Banking
Four New Voters to Join Fed’s Rate-Setting Panel in 2020 Amid Broad Policy Agreement by Michael S. Derby (WSJ)
Two hawks (Kansas City and Boston) and two doves (St. Louis and Chicago) will leave the FOMC in 2020, while hawks from Cleveland and Dallas, a neutral policymaker from Philly, and a dove from Minneapolis will rotate on to the committee. [Link; paywall]
ANALYSIS-Recession, robots and rockets: another roaring 20s for world markets? by Tom Arnold and Elizabeth Howcroft (Reuters)
A speculative forecast about what may await in the next decade: the authors are convinced that direct cash transfers from central banks to consumers are right around the corner. [Link]
Traders Heard a Speech Too Soon by Matt Levine (Bloomberg)
Some long musings on the existential nature of what the line is between quickly-delivered and truly inside information, whether in the stock market or the Bank of England’s press conferences. [Link; soft paywall]
Home On The Range
Perks and Recreation: These $400,000 RVs Are Built for ‘Overlanding’ by Dan Neil (WSJ)
A mashup between a traditional RV and more dynamic off-roading vehicles that aren’t stuck to highways can run into the mid-six figures. [Link; paywall]
The Hottest New Thing in Seasteading Is Land by Lizette Chapman (Bloomberg Quint)
Deranged efforts to avoid taxes by living in international waters have now yielded to slightly less deranged efforts to avoid taxes by living in developing countries. [Link]
Drones
A Big And Bizarre Drone Mystery Is Unfolding In Rural Colorado by Tyler Rogoway (The Drive)
The Mountain West is home to as many oddities as it is acres of open, unused land, and this story about large fleets of commercial drones up to…something fit right in with that longstanding mythos. [Link]
Meet the creepy robots poised to take over the world by Paula Froelich (NY Post)
New form factors for autonomous drones mean they might be one step closer to the kind of ubiquity that has been a hallmark of sci-fi stories for generations. [Link]
Patience Is A Virtue
After Nearly 40 Years, a Biotech Company Readies Its First Product by Bill Alpert (Barron’s)
New Jersey’s Immunomedics has submitted an application for an antibody treatment for breast cancer, after spending the last 35 years as a public company without a product to market to the public. Losses total more than $1bn over that span. [Link; paywall]
Eleven Years in the Making: Breaking Even on JPMorgan’s Purchase of Bear Stearns by David Benoit (WSJ)
After more than a decade, owners of Bear Stearns’ stock on the eve of its takeover by Jamie Dimon’s JP Morgan are now up on their investment. [Link; paywall]
Hedonic Treadmills
Three Theories for Why You Have No Time by Derek Thompson (The Atlantic)
Despite ever-higher standards of living, the most valuable of all commodities feels like it’s in permanently short supply. [Link; soft paywall]
Read Bespoke’s most actionable market research by joining Bespoke Premium today! Get started here.
Have a great weekend!
The Closer: End of Week Charts — 12/27/19
Looking for deeper insight on global markets and economics? In tonight’s Closer sent to Bespoke clients, we recap weekly price action in major asset classes, update economic surprise index data for major economies, chart the weekly Commitment of Traders report from the CFTC, and provide our normal nightly update on ETF performance, volume and price movers, and the Bespoke Market Timing Model. We also take a look at the trend in various developed market FX markets.

The Closer is one of our most popular reports, and you can sign up for a free trial below to see it!
See tonight’s Closer by starting a two-week free trial to Bespoke Institutional now!
B.I.G. Tips – Performance After Years As Strong As 2019
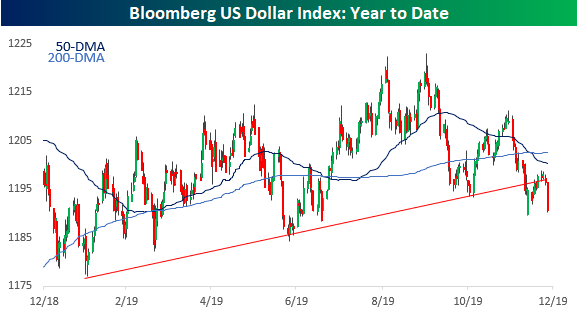
Dollar Doldrums
The President has been vocal for months now in his criticism of the FOMC and how monetary policy has resulted in a dollar that is too strong relative to other global currencies. Based on trends in the dollar during Q4, though, the President may just be getting his wish. The chart below shows the performance of the Bloomberg US Dollar Index throughout 2019. After hitting a YTD high on the first day of Q4, the index has steadily trended lower, falling by more than 2.5% and into the red for the year. After breaking its uptrend earlier this month, the Bloomberg Dollar Index saw a quick bounceback in the middle of the month that ran out of steam right at its former uptrend line. While it was able to maintain that level over the last couple of days, as markets around the world re-opened for trading today, the bottom has really fallen out, and the index is on pace for its lowest close since July 18th.
If the recent weakness in the Dollar Index is a precursor for what’s the come in 2020, investors will be better served to focus on companies that generate a large percentage of their revenues outside the United States, and one great tool to search for companies which generate the largest percentage of their revenues outside of the United States is our International Revenues Database. Sign up for Bespoke Institutional now for our most actionable insights and market analysis as well as full access to our International Revenues Database. CLICK HERE to start a two-week free trial.