What a Difference Two Weeks Makes!
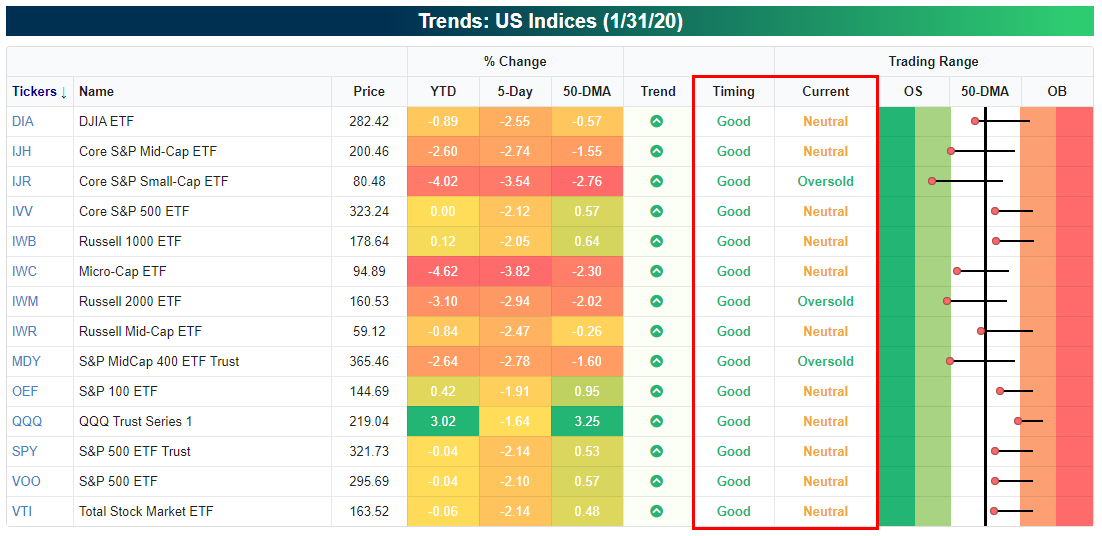
The tone of the market sure did change over the last two weeks! The image below is from our Trend Analyzer screen of US indices as of the close two weeks ago on 1/17. Heading into that weekend, the major US averages were all at ‘Overbought’ or ‘Extreme Overbought’ levels, and while their Trend ratings were all positive, the Timing scores for nearly all of them was ‘Poor’.

Fast-forwarding to the present, it’s a completely different picture for the major US indices. Today, not a single one of the major US index ETFs headed into this weekend overbought at overbought levels, and a few of them are even oversold. Here’s the silver lining, though; since all of their Trend ratings are still positive, their timing scores all rank as ‘Good’. While not what we would classify as a ‘Perfect’ set up right now, for investors who have been waiting for a pullback, the window is starting to open. Start a two-week free trial to Bespoke Institutional for full access to our Trend Analyzer tool, so you can track the key trends of major indices and individual stocks.
The Bespoke Report — 1/31/19
This week’s Bespoke Report newsletter is now available for members.
Along with in-depth analysis of the 2019-nCov outbreak and its potential impact on global financial markets, this week we take a deep dive into recent earnings results from a dozen or so of the largest US companies (see pages 29-31). We also provide our thoughts on potential 2020 election outcomes and whether the market is not yet pricing in the real possibility of socialist Senator Bernie Sanders winning the nomination.
In this week’s Bespoke Report, we provide our take on everything going on in the market this week, including the action in international markets, global economics, and cross-asset price action. To read the report and access everything else Bespoke’s research platform has to offer, start a two-week free trial to one of our three membership levels. You won’t be disappointed!

The Closer: End of Week Charts — 1/31/20
Looking for deeper insight on global markets and economics? In tonight’s Closer sent to Bespoke clients, we recap weekly price action in major asset classes, update economic surprise index data for major economies, chart the weekly Commitment of Traders report from the CFTC, and provide our normal nightly update on ETF performance, volume and price movers, and the Bespoke Market Timing Model. We also take a look at the trend in various developed market FX markets.

The Closer is one of our most popular reports, and you can sign up for a free trial below to see it!
See tonight’s Closer by starting a two-week free trial to Bespoke Institutional now!
Bespoke Market Calendar — February 2020
Please click the image below to view our February 2020 market calendar. This calendar includes the S&P 500’s average percentage change and average intraday chart pattern for each trading day during the upcoming month. It also includes market holidays and options expiration dates plus the dates of key economic indicator releases. Start a two-week free trial to one of Bespoke’s three research levels.

Short Circuit
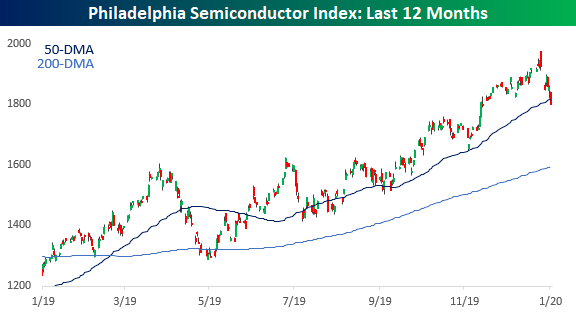
It was just a week ago that the Philadelphia Semiconductor Index (SOX) gapped sharply higher to record highs on the back of strong earnings from Intel (INTC). So much for that rally. By the end of the day last Friday, the SOX was actually down over 1%, and outside of a rally this past Tuesday, it has traded down every day since. From record highs on Friday morning, the SOX is closing out this week down more than 8% from last Friday’s highs and below its 50-day moving average (DMA) for the first time since October. For the last several months, the 50-DMA has acted as support for the SOX, so we’ll be watching closely to see how the index holds up in the days ahead. We’ve repeatedly discussed the importance of the semis as a barometer of the health of the broader market, so it will be important for the group to find its footing soon.
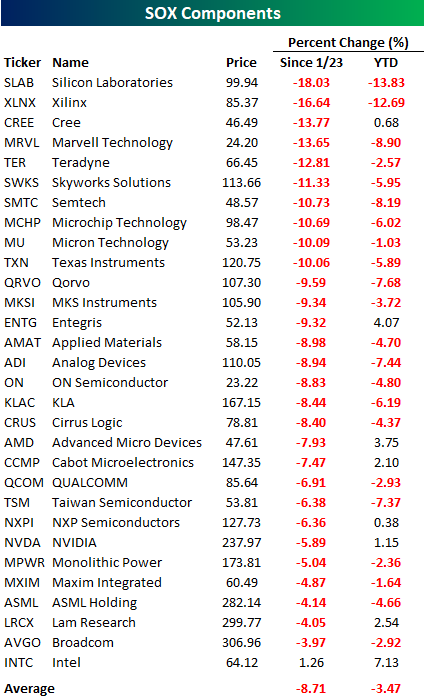
In terms of the SOX’s individual components, the weakness has been broad-based. Since its closing high on 1/23, every member of the SOX besides INTC is down, and INTC is barely up! The average performance of the index’s components since 1/23 has been a decline of nearly 9%, and a third of the components are down by double-digit percentages. Semis had been a leadership group for the market as recently as last week, but after the declines over the last five trading days, the average 2020 performance of stocks in the index is a decline of 3.5% and only eight components are up. Even for the semis, this has been a quick reversal. Start a two-week free trial to Bespoke Institutional for full access to our research and market views.
B.I.G. Tips – February 2020 Seasonality
B.I.G. Tips – CAT Sales Head South
Bespoke’s Morning Lineup – 1/31/20 – One Down, Eleven to Go
See what’s driving market performance around the world in today’s Morning Lineup. Bespoke’s Morning Lineup is the best way to start your trading day. Read it now by starting a two-week free trial to Bespoke Premium. CLICK HERE to learn more and start your free trial.

The Closer – Tech & Utility Market, Energy A/D, Amazon Earnings, GDP, Housing – 1/30/20
Log-in here if you’re a member with access to the Closer.
Looking for deeper insight on markets? In tonight’s Closer sent to Bespoke Institutional clients, we begin with a look across sectors showing the persistent outperformance of the Technology and Utilities sectors as well as the Energy sector’s A/D line which has become very stretched. Then we recap tonight’s earnings reports with particular focus on Amazon’s (AMZN) blowout quarter. Next, we review today’s GDP release and quarterly homeownership and vacancy data.

See today’s post-market Closer and everything else Bespoke publishes by starting a 14-day free trial to Bespoke Institutional today!