Chart of the Day: Stocks vs Bonds
June 2019 Headlines
Trend Analyzer – 7/1/19 – Strong End of June, Strong Start to July
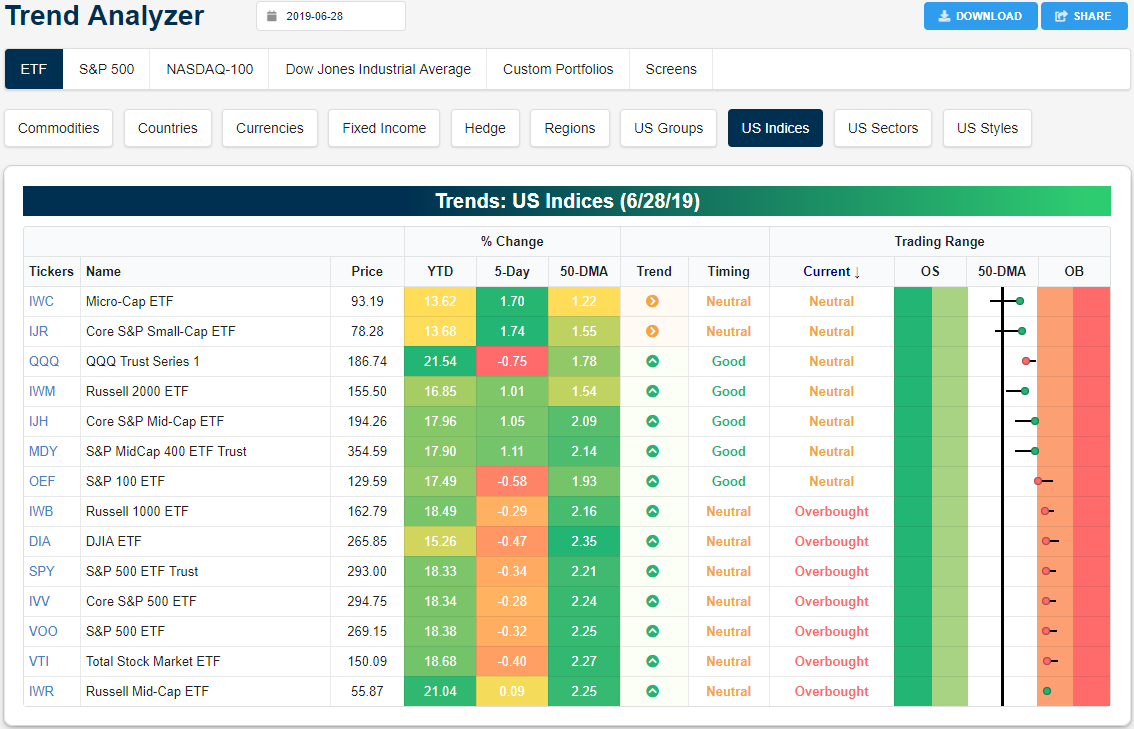
After finishing the session higher on Friday to cap off a strong June and first half of 2019, conditions have not necessarily become overly extended as the major indices work their way back all-time highs. Only half of the 14 the major index ETFs are overbought while the rest are neutral. These overbought ETFs are primarily comprised of large caps including the Dow (DIA), S&P 500 (SPY), and Russell 1000 (IWB). Meanwhile, distancing itself from some of its peers, the Nasdaq (QQQ) was the worst performer last week and has actually fallen out of overbought territory. Now sitting at neutral, QQQ is actually one of the least overbought ETFs of this group.
While large caps are mostly overbought, they are down versus one week ago, and as such, less extended than they were a week ago as well. The red dots and tails to the right in our Trend Analyzer tool show this slight pullback off of more overbought levels. On the other hand, small and mid-caps outperformed last week as each saw a gain of over 1%—save the Russell Mid Cap (IWR) which only rose 0.09% as it is also the most overbought index ETF. The Micro Cap (IWC) and Core S&P Small Cap (IJR) were the strongest performers rising over 1.7%, taking out the 50-DMA in the process. Despite the short term performance for these two, the long term trend is still sideways.
Following geopolitical progress made this past weekend at the G-20 summit, S&P 500 futures have gapped up to all-time highs leading to what will likely be a sizable gap up for other indices at the open as well. As shown in the charts from our Chart Scanner tool below, another gap up will lead some of these index ETFs back up towards their all-time or prior highs. A number of index ETFs reached new highs in the past couple of weeks in the form of both all-time highs for the Dow (DIA) and the S&P 500 (SPY) as well as lower highs like the S&P MidCap 400 (MDY). The major indices once again reaching these highs would be a positive sign for stocks. Similarly, late last week, the small cap IWC and IWM both managed to see some positive technical developments in taking out both the 200 and 50-DMA. Currently, none of the major index ETFs sit below either the 200 or 50-day. Start a two-week free trial to Bespoke Institutional to access our Trend Analyzer tool and much more.
Bespoke ETF Matrix — First Half Asset Class Total Returns
The S&P 500 (SPY) gained 7% on a total return basis in June, leaving it up 18.37% on the year at the halfway mark. The Nasdaq 100 (QQQ) gained 21.54% in the first half, while the Dow was more than 6 percentage points weaker at +15.18%. Mid-caps performed about inline with large-caps in the first half, while small-caps underperformed slightly.
Looking at S&P sectors, Energy (XLE) had a very strong June, but that still wasn’t enough to put it in positive territory for the entirety of the second quarter. Materials (XLB) was the best sector in June with a gain of 11.57%, while Utilities (XLU) was up the least in June at +3.18%. For the first half, Tech (XLK) was up the most at +26.89%. The Tech sector was actually the best performing ETF in the entire matrix in the first half of 2019.
Outside of the US, every country gained in June except India (PIN), which was down 1.44%. For the second quarter and the full first half, Russia (RSX) was the best-performing country. In Q2, RSX gained 14.71%, while the ETF gained 26.03% for the full first half.
Oil (USO) was up 24.53% in the first half, while natural gas (UNG) was down 19.51%. Gold was up 9.86% in the first half, but silver (SLV) was actually down 1.31%.
Finally, Treasury ETFs posted solid returns across the board in the first half, with the 20+ Year (TLT) gaining more than 10%. Start a two-week free trial to Bespoke Premium to see our just-published Mid-Year Outlook report.
Morning Lineup – And They’re Off!
It’s hard to imagine a stronger way to start off the second quarter as US equities and risk assets around the world are surging following what is being billed as a cease-fire in the US-China trade war and President Trump’s meeting with North Korean leader Kim Jung-Un over the weekend.
While the news surrounding trade has been positive, the reality on the ground remains less optimistic. Manufacturing PMIs for the month of June continued to show weakness around the world, and this morning’s ISM Manufacturing report for the US will kick off a busy week of economic data in the US that will go a long way in determining whether the market is correct in its pricing of 100% certainty that the FOMC will cut rates at the end of the month.
Read today’s Morning Lineup to get caught up on everything you need to know ahead of the new trading day including a recap of overnight trading in Asia and Europe as well as a rundown of all economic data released.
Bespoke Morning Lineup – 7/1/19
The S&P 500 SPY ETF is set to gap up more than 1% this Monday morning, so we wanted to highlight a few stats surrounding similar types of moves.
Since 1993 when SPY began trading, there have been 255 gaps up of 1%+, which accounts for 3.8% of all trading days. On these 255 days, SPY has averaged a further gain of 0.20% from the open to the close of trading after the initial jump at the open.
Today is also a Monday morning, and there have been 49 Monday mornings since 1993 in which SPY began the trading week with a 1%+ jump at the open. On these 49 Mondays, SPY has averaged a further gain of 0.18% from the open to the close of trading. Notably, though, returns one week from the open following Monday gaps up of 1% have been poor, with SPY down an average of 1.12% five days later.
It’s also the first trading day of the month. Since 1993, SPY has gapped up 1%+ on the first trading day of the month 16 prior times, which is about 5% of the time. The average open to close change on these days has been positive at +0.34%.
And what about Monday gaps up of 1%+ to start a new month? That has happened 9 times since 1993, which is 7.4% of the time. On these 9 trading days, SPY has basically been flat from the open to the close of trading.
Finally, there have been just 4 starts to a new quarter that have seen 1%+ gaps higher at the open for SPY, and on these 4 days, SPY has continued higher from open to close twice (50%). Five days later, though, SPY has been higher every time.
Today would be the first time in its history that SPY has gapped up 1%+ at the open on the first trading day of July.
Start a two-week free trial to Bespoke Premium to see today’s full Morning Lineup report. You’ll receive it in your inbox each morning an hour before the open to get your trading day started.
Bespoke Brunch Reads: 6/30/19
Welcome to Bespoke Brunch Reads — a linkfest of the favorite things we read over the past week. The links are mostly market related, but there are some other interesting subjects covered as well. We hope you enjoy the food for thought as a supplement to the research we provide you during the week.
While you’re here, join Bespoke Premium for 3 months for just $95 with our 2019 Annual Outlook special offer.
M&A
A New Era For Blockbuster Bank M&A by Nathan Stovall (S&P Global)
In the wake of the massive BB&T/SunTrust merger, the outlook for bank mega-mergers looks sunnier now than it has for some time. Other recent deals follow a similar theme. [Link]
Economic Background
The Balance of Payments by Claus Vistesen (AlphaSources)
A review of the balance of payments: what they are, where they come from, why they should be taken with a grain of salt, and more. [Link; 18 page PDF]
Birth Control
The first clinical trial of a male contraceptive gel is starting in the UK, and it could mean an alternative to the pill by Lindsay Dodgson (Business Insider)
A drug trial is under way in the UK which offers a male alternative to female-only hormonal birth control. The medication offers an additional or alternative family planning method and has some major advantages over existing treatments as far as reliability goes. [Link]
George Rosenkranz, 102, a Developer of the Birth Control Pill, Is Dead by Robert D. McFadden (NYT)
In 1951, George Rosenkranz synthesized the key ingredient that would become hormonal birth control pills, altering the history of human reproduction in the process. [Link]
Edge of Investing
Yale Enlists Endowment Chief to Help Develop New Asset Managers by Janet Lorin (Bloomberg)
A new one-year program offered by Yale School of Management will feature classes from the legendary manager of the school’s endowment, David Swensen. [Link; soft paywall]
Most Interesting ETF Filing Ever: Libra by David Nadig (ETF.com)
The details of Facebook’s new blockchain product look an awful lot like a very plain vanilla exchange traded fund, although the regulatory status of the instrument is significantly less clear. [Link]
Graft
A Plan to Mine the Minnesota Wilderness Hit a Dead End. Then Trump Became President. by Hiroko Tabuchi and Steve Eder (NYT)
A Minnesota mine project’s approval process was brought back from the dead after the major investor bought a house in DC and rented it to Ivanka Trump and Jared Kushner at a sub-4% cap rate. [Link; soft paywall]
Yesterday, I had a story taken down on Forbes for a post about Jedi DoD by John Furrier (Medium)
The Department of Defense’s massive effort to create a secure cloud is ripe for abuses, and Furrier appears to have stumbled on to one at the hands of Cisco. [Link]
Sports Stories
Megan Rapinoe’s greatest heartbreak, and hope by Gwendolyn Oxenham (ESPN)
While Rapinoe’s on-field successes are a massive contrast to the much darker path her brother has walked: more than half of his adult life has been spent incarcerated, and he’s battled drug addiction and gang violence in his path out of darkness. [Link]
‘What’s a Scarlet Letter?’ The Improbable Reinvention of A-Rod by Ben Reiter (Sports Illustrated)
Starting with the question “what is A-Rod doing at the Oscars?” and ending with a spelling lesson, the improbable propriety of Alex Rodriguez’s post-baseball career. [Link]
Europe
EU closes in on plan for European Commission and ECB top jobs by Alex Barker and Mehreen Khan (FT)
Backroom dealings in Brussels are pushing a possible compromise European Commission presidency headed by a center-left Dutchman, a center-right European Parliament president from Germany, and a French ECB President. [Link]
Strange Marketing
Reservations for Taco Bell’s hotel sell out in 2 minutes by Amelia Lucas (CNBC)
A pop-up hotel in Palm Springs offered by Taco Bell for its superfans sold out its 70-room offering almost immediately. [Link]
Tech Dystopia
Hunched backs and double eyelids: How tech-obsessed humans might look in 2100 by Rachel O’Donoghue (Daily Star)
A hypothetical exercise into the possible implications of extreme technology use, just realistic enough to scare readers but probably not something we’re going to see. [Link]
Mortality
‘It’s totally unfair’: Chicago, where the rich live 30 years longer than the poor by Jamiles Lartey (The Guardian)
Poorer sections of segregated Chicago have a life expectancy almost one-third as long as those of richer, whiter neighborhoods. [Link]
Overdose Deaths Likely to Fall for First Time Since 1990 by Jon Kamp (WSJ)
Early results for 2018 show that fatalities related to drug overdoses likely dropped for the first time since 1990. Experts attribute the decline to wider availability of Narcan (a drug that can stop an opiate overdose in its tracks) and possibly (and more darkly) fewer people susceptible to overdose after years of high death counts. [Link; paywall]
Read Bespoke’s most actionable market research by joining Bespoke Premium today! Get started here.
Have a great weekend!
The Bespoke Report: Mid-Year Pros and Cons
This week’s Bespoke Report is an updated version of our “Pros and Cons” edition as we close out the first half of 2019.
With this report, you’re able to get a complete picture of the bull and bear case for US stocks right now. It’s heavy on graphics and light on text, but we let the charts and tables do the talking!
On page three of the report, you’ll see a full list of the pros and cons that we lay out. Page two includes our popular decile analysis for the first half of the year.
To read this report and access everything else Bespoke’s research platform has to offer, start a two-week free trial to one of our three membership levels. You won’t be disappointed!
The Closer: End of Week Charts — 6/28/19
Looking for deeper insight on global markets and economics? In tonight’s Closer sent to Bespoke clients, we recap weekly price action in major asset classes, update economic surprise index data for major economies, chart the weekly Commitment of Traders report from the CFTC, and provide our normal nightly update on ETF performance, volume and price movers, and the Bespoke Market Timing Model. We also take a look at the trend in various developed market FX markets.
The Closer is one of our most popular reports, and you can sign up for a free trial below to see it!
See tonight’s Closer by starting a two-week free trial to Bespoke Institutional now!
Next Week’s Economic Indicators – 6/28/19
In posts yesterday and Monday, we made note of the increasingly disappointing economic data out of the US relative to expectations so far in 2019. This week’s data only added to the woes as the Citi Economic Surprise Index for the US now sits only 0.73% above its April low.
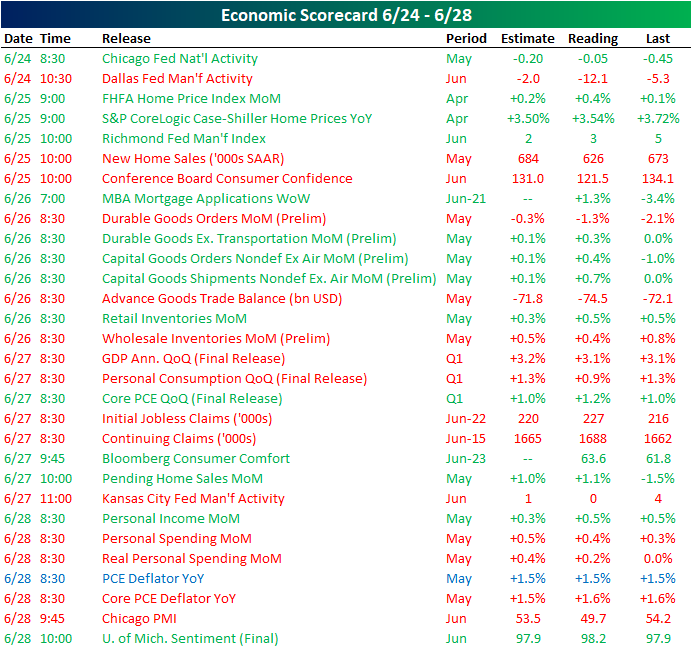
Over half of this week’s releases came in worse than the prior period of estimates. The Chicago Fed’s National Activity Index was the first release this week showing improvements from the April data and coming in above estimates, but the indicator is still showing contracting activity (reading below zero). The Dallas Fed’s Manufacturing Activity index also was out on Monday showing far weaker results. Later in the week, on Thursday, the Kansas City Fed released their own manufacturing activity index completing our Five Fed Composite which is painting a bleak picture for the manufacturing sector. There was also a good amount of housing data this week with overall solid results including stronger than expected home prices (via the FHFA index and S&P CoreLogic’s Case-Shiller Index) but disappointing new home sales on Tuesday, improved MBA Mortgage Applications on Wednesday, and a much better Pending Home Sales print on Thursday. Chicago PMI dropped below 50 on Friday, which is a sign of contraction, but Michigan Confidence beat estimates. One other major release this week was the third and final release of quarterly GDP, which held steady at 3.1% QoQ but was below estimates of an increase to 3.2%.
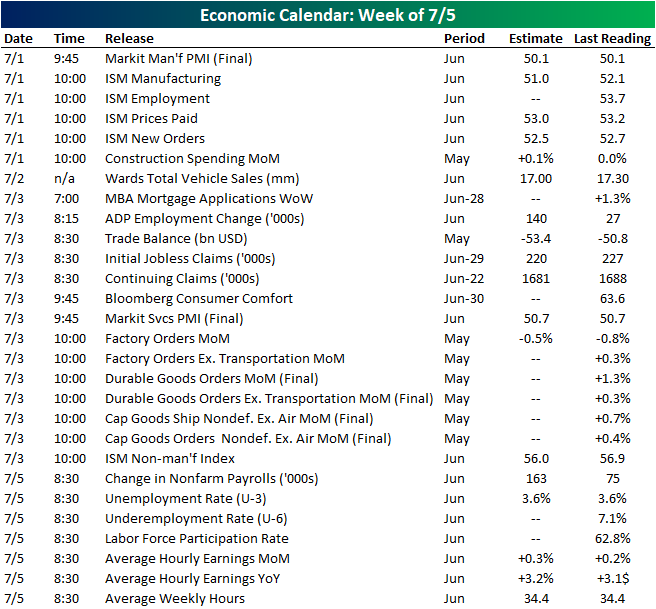
Despite a shortened week due to the July 4th holiday, next week is set up to be a busy one. On Monday, Markit will release their final June PMI on manufacturing alongside the ISM reading later that morning. While Markit measures on manufacturing are expected to hold steady at 50.1, ISM data is anticipated to fall 1.1 down to 51. The only release Tuesday will be data on vehicle sales, which are expected to fall to 17 mm SAAR. On Thursday, there will be no releases and US markets will be shuttered in observance of the July 4th holiday. Additionally, markets will close early (1:00 PM EST) on Wednesday. In spite of this shortened session and day off, there is a huge slug of data to be released Wednesday. Following up the manufacturing PMIs, Markit and ISM non-manufacturing indicators are all due out on Wednesday. In the late morning, final May data on Factory, Durable, and Capital Goods Orders are also going to be released. Alongside the standard Wednesday release of MBA Mortgage Applications, other weekly data that is typically released on Thursday will be pushed ahead one day including Initial Jobless Claims and Bloomberg Consumer Comfort. ADP employment numbers are expected to show improvements when it releases on Wednesday ahead of Friday’s Nonfarm payrolls report, which is also forecasting a solid improvement from the previous month. Start a two-week free trial to Bespoke Institutional to access our interactive economic indicators monitor and much more.
July 4th Market Returns
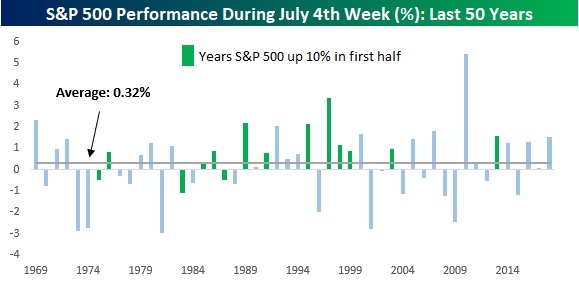
With the first half winding down to a close, Summer is in full swing as July 4th quickly approaches. While the days leading up to or after July 4th are usually on the quiet side with many people taking vacations, for the stock market, it is usually a relatively positive week. The chart below shows the S&P 500’s performance during the July 4th week measuring performance from the Friday before July 4th until the Friday after. In years where July 4th falls on a Friday or Saturday, we measure the S&P 500’s performance in the week leading up to July 4th.
For the July 4th week, going back to 1969, the S&P 500 has seen an average gain of 0.32% with positive returns 60% of the time. In the charts below, we have also included green shading in years where the S&P 500 was up 10%+ in the first half (as it is this year). In those years, returns during the July 4th week have been much better with an average gain of 0.93% and positive returns 79% of the time. In fact, the last time the S&P 500 was down during the July 4th week in a year where the S&P 500 was up 10%+ in the first half was in 1986!
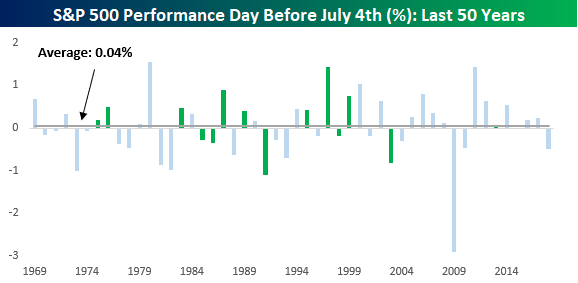
Similar to the July 4th week, the day before July 4th has also historically been positive but not nearly to the same degree. On those days, the S&P 500 has averaged a gain of 0.04% with positive returns only slightly more than half of the time (54%). In years where the S&P 500 was up over 10% in the first half, the day before July 4th is considerably better, averaging a gain of 0.17% with gains 64% of the time.
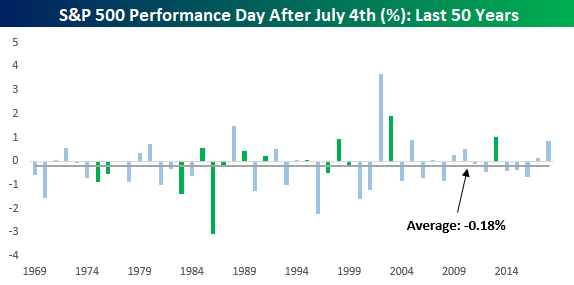
With people out celebrating the July 4th holiday, the hangover sets in after. As shown below, the average S&P 500 change on the trading day after July 4th is a decline of 0.18% with gains only 42% of the time. In years when the S&P 500 was up over 10% in the first half, the declines aren’t as bad, but at -0.12% and gains only half of the time, they aren’t positive either. This year the day after July 4th will also feature the June Non-Farm Payrolls report. That will be fun! Start a two-week free trial to Bespoke Institutional to access our Seasonality Database and much more.
