This Week’s Economic Indicators – 2/10/20
On top of a busy week of earnings, last week also saw 32 economic releases scattered throughout the week, a majority of which came in stronger than expected or stronger than the prior period’s reading. January Markit and ISM gauges on the manufacturing sector led things off on Monday with both improving from December and exceeding estimates. Service counterparts later in the week showed similar improvements and beat expectations. Hard manufacturing data on Tuesday confirmed these results with the December readings on factory orders, durable goods, and capital goods all exceeding or matching expectations, albeit capital goods and durable goods excluding transportation continue to decline month-over-month. Employment data was the highlight of the week with ADP’s reading on Wednesday showing the strongest print since May of 2015 and the biggest beat relative to expectations since December 2011. That was followed by Initial Jobless Claims which came in at their lowest reading since April’s multi-decade low, and finally, Friday’s all-around solid NFP report.

This week, the economic calendar lightens up a bit with a total of 22 data points on the docket. The calendar is back-end loaded with 18 of those 22 data points coming out on Thursday and Friday. As such, there are no releases today so small business optimism from the NFIB kicks things off tomorrow morning. Optimism among small businesses is expected to tick up to 103.5 from 102.7 which would leave it in the middle of the past year’s range. The December Job Openings and Labor Turnover Survey (JOLTS) is the only other release scheduled for Tuesday which is expected to show 6,925,000 job openings in December. Wednesday will likewise be a fairly quiet day with weekly mortgage applications and the budget statement for the month of January the only releases to note.
Again, things will pick up on Thursday and Friday. In addition to the usual weekly releases (jobless claims and Bloomberg Consumer Comfort), on Thursday we will also get hourly earnings and CPI data for January. CPI is expected to be stronger on the headline level but core measures are expected to slow to a 2.2% YoY rate from 2.3% last month. Export and import price indices are out Friday morning alongside the retail sales report for January. Although there is no change expected from December’s data, core measures on sales across the board are forecast to come in weaker. Industrial and manufacturing production are also scheduled to release that morning in addition to preliminary readings for February for the University of Michigan’s Consumer Sentiment index. Start a two-week free trial to Bespoke Institutional to access our interactive economic indicators monitor and much more.

Someone Give the Nasdaq a Mint
With three of the four trillion dollar stocks (Microsoft, Amazon.com, and Alphabet) in the Nasdaq trading at all-time highs today, it’s no surprise that both the Nasdaq 100 and broader Nasdaq Composite are at record highs this morning. From a breadth perspective, though, neither index is as strong.
For starters, even though the Nasdaq 100 is at new highs, the cumulative A/D (advance/decline) line is marginally lower than its high last week. It’s far from a major divergence but does illustrate the fact that some of the largest stocks are carrying the weight of everyone else.
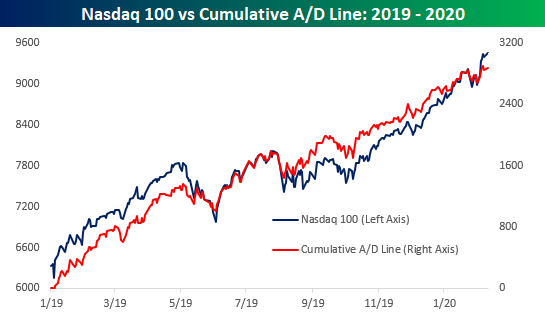
The divergence between the Nasdaq 100’s price and cumulative A/D line is hardly wide enough to get worked up over at this point, but for the broader Nasdaq Composite itself, which includes a much larger universe of smaller companies, the divergence is much more noticeable. In this instance, the Nasdaq’s cumulative A/D line saw a much larger decline than price during the most recent pullback, and the magnitude of the bounce last week and into today has been relatively anemic. This is a much more notable divergence, and one that will become a concerning trend if it continues to drag on. Start a two-week free trial to Bespoke Institutional to access our full suite of research and interactive tools.

January 2020 Headlines
Bespoke’s Morning Lineup – 2/10/20 – Calendar Working in the Bulls Favor
See what’s driving market performance around the world in today’s Morning Lineup. Bespoke’s Morning Lineup is the best way to start your trading day. Read it now by starting a two-week free trial to Bespoke Premium. CLICK HERE to learn more and start your free trial.
US equities closed out last week on a negative note and part of that was likely related to concerns over what could potentially be some bad news related to the coronavirus over the weekend. While there wasn’t any concrete positive news over the weekend, there wasn’t really much in the way to suggest the outbreak is getting any worse either, and that in itself is good news. Futures are modestly lower heading into the trading day, but there isn’t much in the way of potential catalysts on the horizon as the economic and earnings calendars are light for today.

Bespoke Brunch Reads: 2/9/20
Welcome to Bespoke Brunch Reads — a linkfest of the favorite things we read over the past week. The links are mostly market related, but there are some other interesting subjects covered as well. We hope you enjoy the food for thought as a supplement to the research we provide you during the week.
While you’re here, join Bespoke Premium for 3 months for just $95 with our 2020 Annual Outlook special offer.
Weird Politics
GOP-affiliated group intervenes in Democratic primary for US Senate seat in North Carolina by Alex Rogers (CNN)
Worried about the general election, a Republican group is advertising for a Democrat in order to force her front-running competitor to lay down cash in a primary fight. [Link]
Vermin Supreme, the “Elder Statesman of Wingnuts,” Says His 2020 Presidential Campaign Is for Real by Lucy Diavolo (Teen Vogue)
A look at the weirdest run for national office under way this cycle, conducted by an aging hippie who quite literally goes by the name “Vermin Supreme”. In our view, this bit of ridiculousness being documented in Teen Vogue really ties the story together. [Link]
Faulty Iowa App Was Part of Push to Restore Democrats’ Digital Edge by Matthew Rosenberg, Nick Corasaniti, Sheera Frenkel and Nicole Perlroth (NYT)
In an effort to return the Democrats’ digital advantage from the Obama years, the party tried to develop an app that would improve the Iowa Caucus reporting. That didn’t go so well, as is now obscenely clear. [Link; soft paywall]
Teens have figured out how to mess with Instagram’s tracking algorithm by Alfred Ng (CNet)
In an effort to preserve privacy and keep their online lives their own, young people are starting to take some innovative steps to prevent algorithms from filling their feed with the kind of content they browse already. [Link]
Instagram Brings In More Than a Quarter of Facebook Sales by Sarah Frier and Nico Grant (Bloomberg)
A report this week showed Instagram generating more than $20bn in 2019 sales, 20x what Facebook paid for the app in 2012 and a quarter of the company’s overall business. [Link; soft paywall]
Lane of Luxury
Secrets and Stick Shifts: Why Chateau Marmont Valets Are “Unsung Heroes” of Hollywood by Gary Baum (The Hollywood Reporter)
The Chateau Marmont in Los Angeles has had the same four valets for the past thirty years, an incredible track-record for such a low pre-requisite role…even one that involves the sort of luxury vehicles that the Marmont valets are entrusted with. [Link]
NFL players trade in gas-guzzling SUVs for all-electric Teslas by Jessica Golden (CNBC)
Battery-powered sedans are becoming the standard conveyance for NFL stars at the Super Bowl, a big change from years past. [Link]
Utilities
Should Public Transit Be Free? More Cities Say, Why Not? by Ellen Barry (NYT)
Tests in cities around the country are indicating that transit ridership surges when even small fairs are removed from city transit systems. The enthusiasm is ironic given the new MTA commitments to fare policing. [Link; soft paywall]
When a small town loses its only bank by Kevin Wack (American Banker)
While we all feel frustrated with our banks from time-to-time, their inconveniences are nothing compared to the pain of not having any access to a financial institution. [Link]
The Impact of Student Loan Debt on Small Business Formation by Brent W. Ambrose, Larry Cordell, and Shuwei Ma (Philly Fed Working Papers)
The authors find a significant decline in small business formation as a function of increases in student loan debt; ex-students who are saddled with student loans are unable to use personal debt to finance new business formation. [Link; 32 page PDF]
Apple Watch outsold the entire Swiss watch industry in 2019 by Arjun Kharpal (CNBC)
While Swiss watchmakers sold about 21 million units in 2019, Apple shipped almost 31 million of its wrist-borne personal computers. [Link]
Renewables
Greenhouse gas emissions drop in Spain as power plants ditch coal by Manuel Planelles (El Pais)
Spanish CO2 emissions fell by a third in 2019 as the company rapidly halted coal mining, shuttered coal plants, and spun up new renewable projects to replace the lost capacity. [Link]
Personal Data
A Court Tried To Force Ancestry.com To Open Up Its DNA Database To Police. The Company Said No. by Peter Aldhous (BuzzFeed News)
Ancestry.com refused a warrant for access to its DNA database, which it claimed was improperly received, as it seeks to defend users’ privacy against government demands for access in order to build genetic profiles which may help narrow searches for suspects. [Link]
Cards For Employee-Ownership
Cards Against Humanity Bought Clickhole by Katie Notopoulos (BuzzFeed News)
Satirical site Clickhole was spun out of G/O Media Group (owners of The Onion, which spawned Clickhole originally) in a sub-$1mm all-cash deal that puts employees of the site in control. The game company will not exercise editorial control. [Link]
Wild In Wylie
This Southern Town Was Growing So Fast, It Passed a Ban on Growth by Valerie Bauerlein (WSJ)
A suburb of Charlotte, North Carolina tripled in population over the past twenty years, and is now trying to come to grips with the reality of rapid, unconstrained, and unplanned growth without sufficient regard for the infrastructure that supports it. [Link; paywall]
Hedge Funds
Ray Dalio Is Still Driving His $160 Billion Hedge-Fund Machine by Rachael Levy and Rob Copeland (WSJ)
10 years ago, Dalio had planned to give up control of his massive pool of capital, but at 70 years old his long string of failed leadership solutions hasn’t led to anything fruitful. [Link; paywall]
Read Bespoke’s most actionable market research by joining Bespoke Premium today! Get started here.
Have a great weekend!
The Bespoke Report – 2/7/20 – Holding Our Breadth and Our Chips
This week’s Bespoke Report newsletter is now available for members.
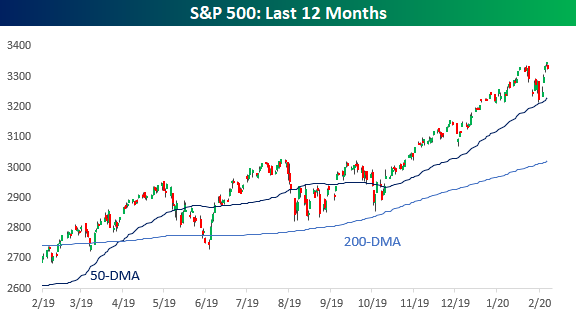
What a difference a week makes. Last week at this time, we noted on the website, that based on the Timing scores in our Trend Analyzer tool, the short-term picture for major US averages had shifted from ‘Poor’ or ‘Neutral’ as of 1/17 to ‘Good’ for every single one. We noted that “While not what we would classify as a ‘Perfect’ set up right now, for investors who have been waiting for a pullback, the window is starting to open.” The window didn’t stay open for long, though, as the S&P 500 rallied and rallied hard this week. With a gain of over 3% on the week, it was the best week since June.
In this week’s Bespoke Report, we provide our take on everything going on in the market this week, including the latest on the coronavirus, market internals, economic data, and earnings season. To read the report and access everything else Bespoke’s research platform has to offer, start a two-week free trial to one of our three membership levels. You won’t be disappointed!

The Closer: End of Week Charts — 2/7/20
Looking for deeper insight on global markets and economics? In tonight’s Closer sent to Bespoke clients, we recap weekly price action in major asset classes, update economic surprise index data for major economies, chart the weekly Commitment of Traders report from the CFTC, and provide our normal nightly update on ETF performance, volume and price movers, and the Bespoke Market Timing Model. We also take a look at the trend in various developed market FX markets.

The Closer is one of our most popular reports, and you can sign up for a free trial below to see it!
See tonight’s Closer by starting a two-week free trial to Bespoke Institutional now!
Bespoke Investor Tools in Action
Here at Bespoke, we’re respected and trusted for our thoughtful investment research. But many in the industry do not even know that we also have an easy-to-use set of extremely useful investor tools that are available at very attractive pricing compared to competitors.
Today we want to show you a number of these investor tools. We might just have exactly what you’ve been looking for all these years! And you can gain access with a 14-day free trial right now.
Upon logging in as a Bespoke subscriber and clicking on our Tools page, you’ve got easy access to everything. The first tool to highlight is our Trend Analyzer, highlighted in yellow below:

Our Trend Analyzer uses a proprietary algorithm to identify how stocks and ETFs are trending. Use it to monitor your own positions for new uptrends or downtrends or overbought/oversold levels. You can also use it to find new stocks or ETFs that are trading at attractive entry points.

Next up is our Chart Scanner, which is a chart reader’s dream.

Our Chart Scanner lets you browse through hundreds of charts in a matter of minutes. It’s one of our favorite tools for finding new stocks or ETFs to buy based on technicals. If you like a chart and want to monitor it going forward, simply click on the chart’s “bull” icon, and we’ll store that chart for you in your “My Charts” section. You simply have to use this tool to understand how helpful it really is!

Ever wonder about the “January Effect” or “Sell in May, and Go Away”? Our Seasonality Tool is the place to go.

Our Seasonality Tool tells you how the S&P 500 typically trades over any time frame throughout the trading year based on historical patterns. You can also track seasonality trends for other countries and asset classes, US sectors and groups, and even individual stocks.

Our Earnings Explorer is one of the most comprehensive and complete databases of upcoming and historical earnings reports in existence. We’ve been collecting quarterly earnings info for US stocks for nearly two decades, and all of it is available to you with this tool.

Our Earnings Explorer contains a full calendar of upcoming earnings reports across the US stock market. It also contains historical quarterly reports for nearly every US company over the last 20 years. And it has a screening feature so you can seek out new trade ideas based on healthy (or unhealthy) stock-specific earnings trends.
This is another tool you simply have to see to believe! Once you use it, you won’t know how you got by without it.

Our Economic Monitor is the place to go for anything related to recent or upcoming economic releases both in the US and around the world.

Use the Economic Monitor to stay on top of estimates for upcoming economic releases. This tool features a full economic indicators calendar for both the US and the rest of the world. We also provide in-depth analysis of Federal Reserve commentary and other major central banks across the globe.

Our International Revenues tool is a must-have for serious investors. Every investor should know the geographic revenue breakdown for companies they own.

Companies that generate most or all of their revenues outside of the US are much different than companies that generate most or all of their revenues domestically. When the US dollar is rising, versus the rest of the world, “domestic” companies stand to benefit. The opposite is true when the dollar is falling or international economies are outperforming the US. Our International Revenues tool tells you the domestic vs. international revenue breakdown for every stock in the S&P 500 and Russell 1,000.

Our Triple Plays tool features stocks that we consider to be the “cream of the crop” based on earnings trends.

A “triple play” occurs when a company reports earnings and 1) beats consensus analyst EPS estimates, 2) beats consensus analyst sales estimates, and 3) raises forward guidance. Over the years, a large number of our long ideas for our model portfolios have come from this list of recent earnings triple plays.

Our Economic Indicators database contains historical data for every major US economic release (40+).

If you ever need historical data for economic indicators, this database has it. Easily pull up historical release info for every major US economic indicator. It contains the actual reported number at the time of the release along with the consensus economist estimate at the time. We also include helpful info for traders that shows how the S&P 500 and major sectors reacted on the day of the release. We also show how the equity market typically trades in reaction to a better or worse than expected report.

Our Security Analysis page helps you analyze individual stocks and ETFs.

Use our Security Analysis page for stocks or ETFs that you want to analyze. We include upcoming earnings info, trend and timing analysis, price charts and technical tools, and historical earnings information. You can also read up on any research we’ve done on the ticker you’ve searched for.

Our Biggest Movers tool is a simple way to monitor the stock market’s biggest movers on a daily basis.

Each day you can use our Biggest Movers tool to find the stocks and ETFs that experienced the biggest price changes or biggest volume surges.

Remember, our Tools section is just one part of what members gain access to. You also gain access to our flagship investment research product as well as our Custom Portfolios tool, which helps you easily monitor the stocks and ETFs most important to you. Today you can gain access to EVERYTHING — the research, the tools, the custom portfolios — with a 14-day free trial. We think you’ll find that it’s well worth it. If you don’t, you can cancel at any time. CLICK HERE TO START YOUR 14-DAY FREE TRIAL NOW.
Bespoke’s Morning Lineup – 2/7/20 – Payrolls Take Center Stage
See what’s driving market performance around the world in today’s Morning Lineup. Bespoke’s Morning Lineup is the best way to start your trading day. Read it now by starting a two-week free trial to Bespoke Premium. CLICK HERE to learn more and start your free trial.
Futures are lower heading into the monthly employment report, and after all the gains we have had this week, you can’t blame people for being a little more cautious heading into the weekend. Even with the pace of new cases of the coronavirus decelerating, who knows what kind of news can come out over the weekend.
Yesterday we published our monthly preview of the Non-Farm Payrolls report including the historical reaction of the S&P 500 and various sectors in reaction to the report. If you haven’t seen it already, make sure to check it out. Below we have provided a snapshot of consensus expectations heading into the report.

The Closer – Rotation, Rideshare, Energy, Productivity, – 2/6/20
Log-in here if you’re a member with access to the Closer.
Looking for deeper insight on markets? In tonight’s Closer sent to Bespoke Institutional clients, begin with a decile analysis of the last 4 days and then go over Uber’s (UBER) earnings results. Next we, take a look at the collapse of energy stocks and how they now take up a record low share of S&P 500 market cap. Shifting to economic data, we delve into Q4 productivity numbers and Bloomberg’s weekly Consumer Comfort index.

See today’s post-market Closer and everything else Bespoke publishes by starting a 14-day free trial to Bespoke Institutional today!