Chart of the Day: CPI Surges Just In Time For Fed To Cut
Lowest Claims In Three Months
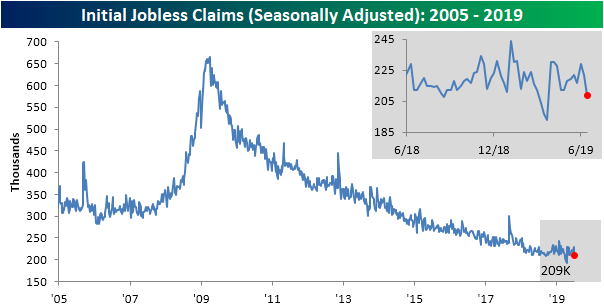
Fed Chair Powell’s testimony on Capitol Hill yesterday made frequent mentions of the strength of the labor market, and initial jobless claims data released this morning helped to give further support of this strength. Claims were expected to come in unchanged from last week at 221K but instead fell to a seasonally adjusted level of 209K. That is the lowest print in about three months (since April 12th) when claims came in at the multi-decade low of 193K. Whereas the past few weeks were near the upper end of the past year’s range, this drop now brings claims back down towards the lower end of that range. In other words, while not a new low, it is still a healthy number. As such, the record streaks at or below 250K and 300K continue at 92 weeks and 227 weeks, respectively.
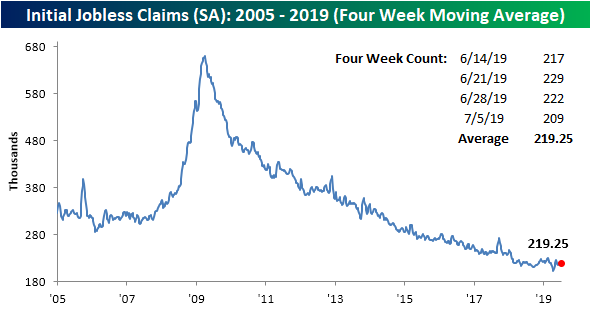
The four-week moving average helps to sift out some of the fluctuations of the high-frequency weekly data. This week saw the moving average fall from 222.5K down to 219.25K. Unlike the weekly number, there were actually several lower prints throughout the past couple of months, so this does not bring the indicator back towards the lower end of its range. In fact, this decrease only brings things back to where they stood about one month ago.
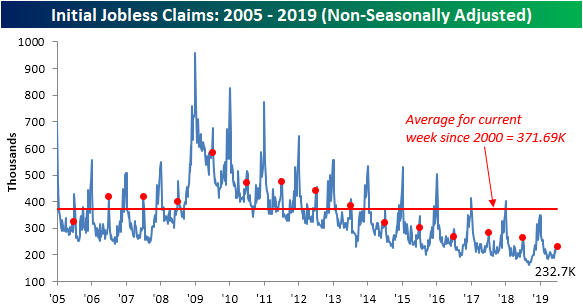
As could be expected given seasonal patterns, on a non-seasonally adjusted basis, claims rose to 232.7K after falling to 224.5K last week. Typically, the current week of the year sees a sizeable increase in claims averaging a week-over-week rise of over 42K over the past fifteen years, but this week’s change was much smaller with only an 8.2K increase. This week’s NSA number was also lower than the comparable week in 2018 when NSA claims were 264.9K. Additionally, this was the lowest reading in claims for the current week of the year of the current cycle and it was substantially under the average for the past couple of decades of 371.69K. Start a two-week free trial to Bespoke Institutional to access our interactive economic indicators monitor and much more.
The Bespoke 50 Top Growth Stocks
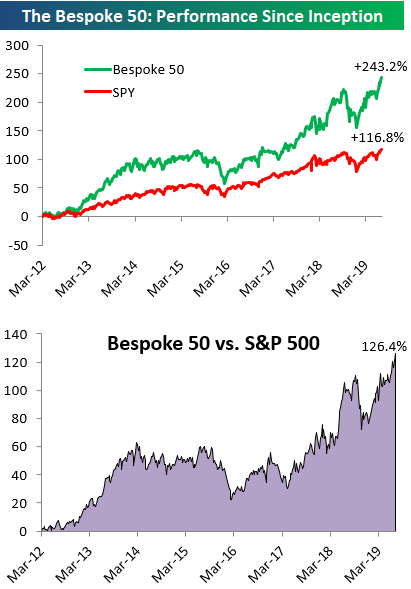
Every Thursday, Bespoke publishes its “Bespoke 50” list of top growth stocks in the Russell 3,000. Our “Bespoke 50” portfolio is made up of the 50 stocks that fit a proprietary growth screen that we created a number of years ago. Since inception in early 2012, the “Bespoke 50” has beaten the S&P 500 by 126.4 percentage points. Through today, the “Bespoke 50” is up 243.2% since inception versus the S&P 500’s gain of 116.8%. Always remember, though, that past performance is no guarantee of future returns. To view our “Bespoke 50” list of top growth stocks, please start a two-week free trial to either Bespoke Premium or Bespoke Institutional.
Extreme Equity Fund Outflows
Recent data from the Investment Company Institute shows that mutual fund investors are fleeing equity funds at a staggering pace. As shown in the table below, one-week outflows from equity funds were larger (more negative) than all but 2% of prior periods since 2007. The four week sum of flows is similarly negative. At the same time, fixed income mutual funds are seeing huge and consistent inflows, with total bond flows near the 90th percentile this week.
As shown in the charts below, the one-week collapse in equity fund flows are not without precedent. That said, only periods with extreme equity market volatility saw similarly large declines in cash. January 2008 (as the financial crisis was picking up), October 2008 (in the wake of Lehman and TARP), March 2009 (the ultimate low for the equity market), August 2011 (the US debt downgrade), November 2016 (the last Presidential election) and January of this year (when equities had dropped almost 20% from closing highs). Unlike all of those prior instances, stocks are near all-time highs and volatility is extremely low, presenting an interesting puzzle for assessing the sentiment implications of equity fund outflows. Start a two-week free trial to Bespoke Institutional for access to our weekly fund flows analysis in our Closer report.
Bespoke’s Morning Lineup – Fed Flood
If you thought yesterday was a busy day of Fed headlines, you ain’t seen nothing yet! In addition to another round of testimony from Fed Chair Powell in front of the Senate today, five other Fed officials are on the calendar starting with Williams at 11:10 AM and ending with Kashkare at 5:00 PM. In addition, we’ll also get jobless claims (221K expected) and CPI at 8:30 AM. There’s not much in the way of earnings news today, but that will all change next week, so check out our Earnings Explorer for a look at companies scheduled to report.
Read today’s Morning Lineup to get caught up on news and stock-specific events ahead of the trading day and a further discussion of overnight events in Asia and Europe.
Bespoke Morning Lineup – 7/11/19
One thing we have grown accustomed to with this market is for breadth, as measured by the S&P 500 cumulative A/D line, to lead price action higher, so we were a bit surprised yesterday to see that even as the S&P 500 made a new intraday high (but didn’t make a new high on a closing basis), the cumulative A/D line remains off its highs. As shown in the chart below, the cumulative A/D line is only slightly below its prior highs, so it’s way too early to start calling this a divergence, but it’s just something that stuck out to us when we were going through the charts last night.

Start a two-week free trial to Bespoke Premium to see today’s full Morning Lineup report. You’ll receive it in your inbox each morning an hour before the open to get your trading day started.
Bed Bath & Beyond Brutal
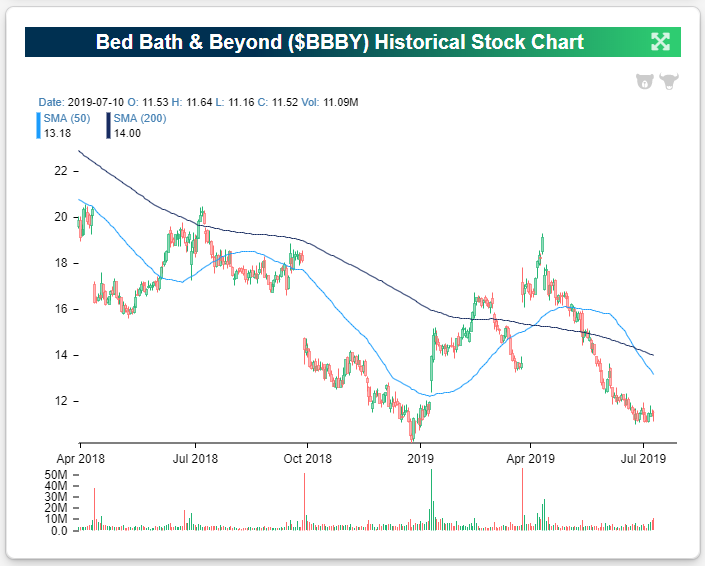
Bed Bath & Beyond (BBBY) was an $80 stock back in early 2015, but it’s trading at $11 this morning which represents a drop of 86% from its highs. The stock has been in a perpetual downtrend since peaking four years ago, and the news didn’t get better when the company reported earnings after the close yesterday. Shares are currently set to open down 5%.
Below is a snapshot of BBBY earnings reports over the last three years using our Earnings Explorer tool. We’ve highlighted the stock’s percentage move at the open of trading (versus the prior day’s close) following its quarterly earnings reports over this time period. Aside from one gap up of 7.75% following its January 2019 report, the stock has gapped down sharply on seven of its last eight reports. This morning’s gap down of 5% will be its eighth gap down of 5%+ out of its last nine reports. Start a two-week free trial to one of Bespoke’s three premium research services.
Biggest Winners and Losers 7/10/19
Below is a list of today’s biggest losers in the S&P 1500. Realogy (RLGY) and Granite Construction (GVA) took it on the chin the most with drops of 9%+. Other notables on the list of biggest losers include Applied Opto (AAOI), Hanesbrands (HBI), Pitney Bowes (PBI), and WW Grainger (GWW). Start a two-week free trial to one of Bespoke’s three premium research services.
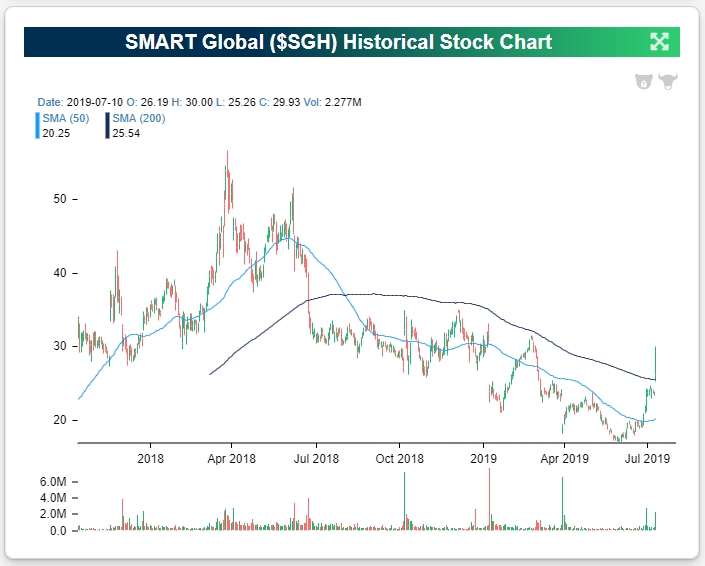
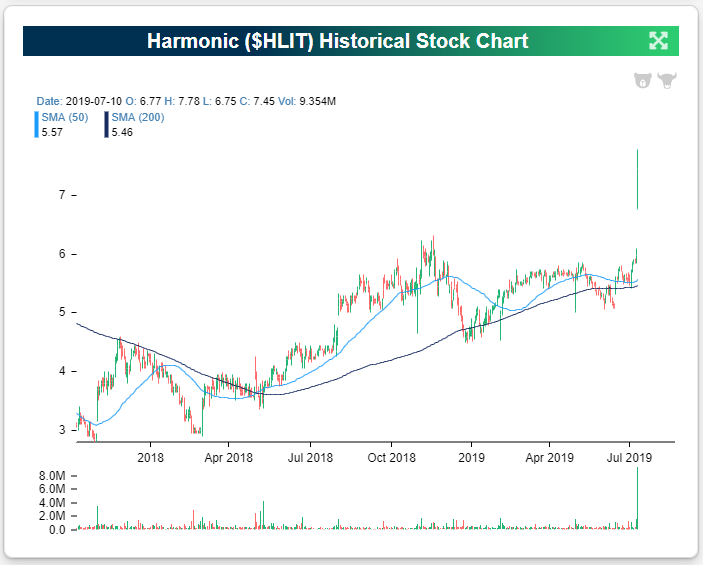
SMART Global (SGH) and Harmonic (HLIT) — two Tech stocks — gained nearly 25% in today’s trading. Three Energy stocks followed the two big Tech winners with moves of 11%+. McDermott (MDR) gained 12.89%, Pioneer Energy (PES) gained 12.5%, and Noble Energy gained 11.17%. Note that Pioneer and Noble have extremely low share price levels at this point, so just a small change in price represents a big percentage move. WD-40 (WDFC) is a stock we highlighted in a post yesterday for reporting a triple play, and it shows up on the biggest winners list as well with a gain of 8.55% on the day.
Below are price charts for SGH and HLIT — yesterday’s two biggest gainers. SGH had been in a steep 12+ month downtrend before yesterday’s move, while HLIT looks much different, breaking out to new highs from what was already a nice uptrend channel. Subscribe to Bespoke Premium for access to our interactive investor tools, including our list of the day’s biggest winners and losers and biggest volume movers.
The Closer – Earnings Trends, Cyclical Bounce, Banks Weak, Fedspeak, ICI, EIA – 7/10/19
Log-in here if you’re a member with access to the Closer.
Looking for deeper insight on markets? In tonight’s Closer sent to Bespoke Institutional clients, we take a look at earnings estimates given the S&P 500’s 200-DMA, cyclicals rally, and bank’s underperformance. With Fed Chair Powell’s testimony on Capitol Hill acting as the day’s major catalyst, we then give an updated look at our Fedspeak monitor and some analysis on Fed policy. We finish with our weekly looks at ICI Fund Flows and EIA data.

See today’s post-market Closer and everything else Bespoke publishes by starting a 14-day free trial to Bespoke Institutional today!
Bespoke Consumer Pulse Report – July 2019
Bespoke’s Consumer Pulse Report is an analysis of a huge consumer survey that we run each month. Our goal with this survey is to track trends across the economic and financial landscape in the US. Using the results from our proprietary monthly survey, we dissect and analyze all of the data and publish the Consumer Pulse Report, which we sell access to on a subscription basis. Sign up for a 30-day free trial to our Bespoke Consumer Pulse subscription service. With a trial, you’ll get coverage of consumer electronics, social media, streaming media, retail, autos, and much more. The report also has numerous proprietary US economic data points that are extremely timely and useful for investors.
We’ve just released our most recent monthly report to Pulse subscribers, and it’s definitely worth the read if you’re curious about the health of the consumer in the current market environment. Start a 30-day free trial for a full breakdown of all of our proprietary Pulse economic indicators.
New Highs For S&P 500 But Not a Lot of Sectors
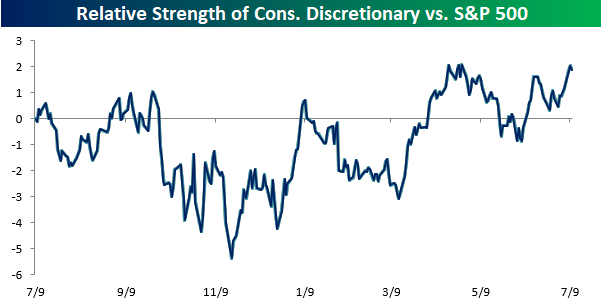
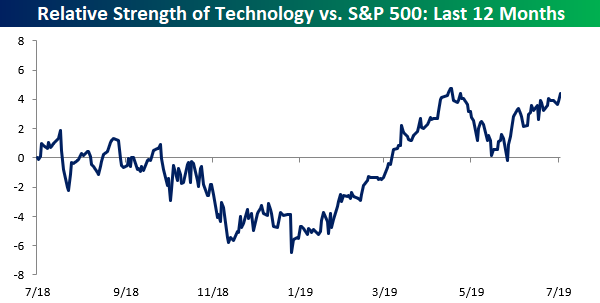
It was a monumental milestone for the S&P 500 earlier today as the index briefly crossed 3,000 for the first time in its history. While the S&P 500 traded up to a new all-time high, it was interesting to see that not a single sector made a new high in terms of their relative strength versus the index. The only two sectors where relative strength is even close to a 52-week high versus the S&P 500 are Consumer Discretionary and Technology. Just two sectors hitting new highs on a relative basis may not sound too impressive, but when those two sectors account for nearly one-third of the entire index, it’s not as bad.
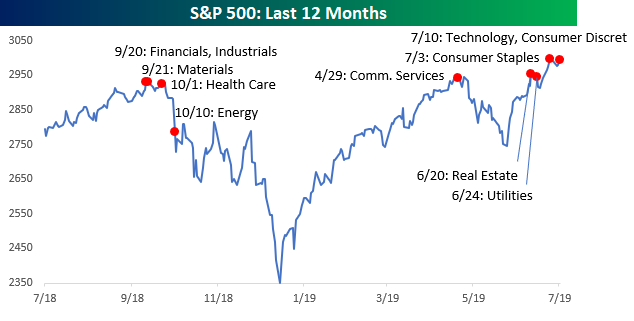
While no sectors are hitting new highs today on a relative basis, a number of sectors have recently hit new highs on an absolute basis. The chart below shows the S&P 500 over the last year, and on it we have notated the date of each sector’s 52-week high. When the S&P 500 recently first made a new high, the rally was being led by defensives like Real Estate and Utilities which made their highs on 6/20 and 6/24, respectively. On 7/3, another defensive sector joined the fray as Consumer Staples rallied to a new high. Today, we are finally beginning to see some non-defensive sectors get in on the act as both Consumer Discretionary and Technology made new highs. Trailing way back in the dust of these sectors are Financials, Industrials, Materials, and Health Care, which haven’t made new highs in over eight months. If these sectors can make it over the hump, the S&P will likely be in the midst of a big leg higher. Start a two-week free trial to Bespoke Institutional to access our full research suite.
