Bespoke Brunch Reads: 7/14/19
Welcome to Bespoke Brunch Reads — a linkfest of the favorite things we read over the past week. The links are mostly market related, but there are some other interesting subjects covered as well. We hope you enjoy the food for thought as a supplement to the research we provide you during the week.
While you’re here, join Bespoke Premium for 3 months for just $95 with our 2019 Annual Outlook special offer.
Physical Performance
Unlocking the mystery of superhuman strength by Scott Eden (ESPN)
An investigation of the extreme increases in physical performance human beings are capable of when adrenaline and survival instincts converge during life-or-death situations. [Link]
‘These kids are ticking time bombs’: The threat of youth basketball by Baxter Holmes (ESPN)
Extreme specialization, high workout loads, and little downtime are breaking young bodies before they can perform at an elite level in the NBA. [Link; auto-playing video]
Weird Sports
Redskins’ Norman runs with bulls in Pamplona (ESPN)
Seeing an NFL cornerback leap over a bull is worth the price of admission. Norman is a regular visitor to Pamplona in the offseason, wowing Spanish crowds with his athleticism. [Link; auto-playing video]
The AHL App Melted Down And Demanded $6,000 From A Guy Named Stewart by Laren Theisen (Deadspin)
An all-timer app blow up led to a series of totally ridiculous notifications sent to AHL fans via the hockey league’s app. [Link]
Investing
Fund Blowups Rekindle Doubts About ETF Liquidity in Crisis Times by Rachel Evans and Emily Barrett (Bloomberg)
The latest terror to grip markets is the idea that investors who use ETFs as cash substitutes won’t be able to liquidate in a large price shock. [Link; soft paywall]
Sub-Zero Yields Start Taking Hold in Europe’s Junk-Bond Market by Laura Benitez and Tasos Vossos (Bloomberg)
With benchmark rates deep in negative territory, short-term junk debt is trading at negative yields in Europe as it approaches maturity. [Link; soft paywall]
As Stocks Surge to Records, Nervous Investors Buy Bonds, Too by Daniel Kruger (WSJ)
Bond funds have seen massive inflows as individual investors load up on Treasuries and other low risk securities despite an equity market at record highs. [Link; paywall]
Economic Research
Study: The value of data in Canada: Experimental estimates (StatsCan)
A new analysis by Canada’s statistics agency has identified the scale of nonresidential fixed investment in data products. The agency estimates somewhere between 105bn CAD and 150bn CAD in data alone, with billions more invested in databases and data science. [Link]
From Policy Rates to Market Rates—Untangling the U.S. Dollar Funding Market by Gara Afonso, Fabiola Ravazzolo, and Alessandro Zori (NY Fed)
An extremely helpful background brief on the structure and flow of US money markets, complete with an interactive infographic. [Link]
Confederate Streets and Black-White Labor Market Differentials by Jhacova Williams (Google Docs)
A working paper from Clemson University’s Williams uses a novel identification technique to identify racial animus. Areas that honor Confederate Generals with street names have higher labor market inequality between blacks and whites, robust across a number of controlling factors. [Link; 37 page PDF]
Russia
Revealed: The Explosive Secret Recording That Shows How Russia Tried To Funnel Millions To The “European Trump” by Alberto Nardelli (BuzzFeed News)
Audio recordings reveal that top officials from Italy’s Lega Nord party met with Russian state actors who proposed a funding scheme that would have violated Italian law. [Link]
Crew of Russian Nuclear Sub Prevented ‘Planetary Catastrophe,’ Officer Says by Henry Meyer and Stepan Kravchenko (Bloomberg)
A fire onboard a Russian submarine nearly created a massive nuclear accident that would have poisoned oceans for generations. [Link; soft paywall, auto-playing video]
Corporate Finance
Buybacks: An Inside View (Sullimar Investment Group)
A $1bn buyback funded with a revolving credit facility saved Delta (DAL) more in dividend payments than it cost in interest payments. [Link]
This Warby Parker Co-Founder’s Next Startup Set Out to Beat a Razor Giant. 6 Years Later, He Sold Harry’s for $1.3 Billion by Tom Foster (Inc.)
Jeff Raider is a co-founder of iconic eyeglass brand Warby Parker as well as the massively successful razor company Harry’s, which was bought out by Schick’s parent company for $1.4bn. [Link; auto-playing video]
Walmart Got a $10 Billion Surprise After Buying Flipkart by Saritha Rai (Bloomberg)
Wal-Mart bought control of India’s leading e-commerce player last year, including an interest in a payments subsidiary which could lead to a $10bn windfall for the American retailer. [Link; soft paywall, auto-playing video]
Long Reads
The Young And The Reckless by Brenden Koerenr (Wired)
An incredible story about a Canadian teenager who ran a business selling level ups on Xbox games that eventually spiraled completely out of control. [Link; soft paywall]
Irony, Thy Name Is Gravy
Boston Market No Longer Has A Boston Location by Cameron Spearance (BisNow)
With 10% of the chain’s locations closing, there are now zero Boston Market locations inside the city of Boston. [Link]
Labor Markets
Amazon’s Latest Experiment: Retraining Its Work Force by Ben Casselman and Adam Satariano (NYT)
The e-commerce giant needs a more intensively trained workforce to operate higher value-add roles, so it’s investing $700mm in re-training a third of its workforce to raise productivity. [Link]
History
Understanding the Burr-Hamilton Duel by Joanne B. Freeman (Gilder Lehrman Institute of American History)
On the 215th anniversary of the most pivotal duel in American history, take some time to get reacquainted with the killing that altered American history. [Link]
The Story of Humans and Neanderthals in Europe Is Being Rewritten by Ed Yong (The Atlantic)
A homo sapiens skull found in a Greek cave is the oldest one discovered outside of Africa, casting doubt on longstanding theories about the spread of our species from its original home. [Link]
Pictures
It Looks Like a Lake Made for Instagram. It’s a Dump for Chemical Waste. by Andrew E. Kramer (NYT)
A brilliant blue lake in Siberia has become a magnet for Russian social media influencers, but its striking color is actually caused by pollution from a nearby power plant; if this isn’t a perfect metaphor for influencer culture, we’re not sure what is. [Link; soft paywall]
What Do People In Solitary Confinement Want To See? by Doreen St. Félix (The NYer)
There is almost nothing more psychologically painful than being cut off from all human contact, as prisoners in solitary confinement are. A new project seeks to connect them with pictures, letting them connect with a world beyond their confinement. [Link; soft paywall]
Read Bespoke’s most actionable market research by joining Bespoke Premium today! Get started here.
Have a great weekend!
The Bespoke Report – The Calm Before the Storm
This week’s Bespoke Report newsletter is now available for members.
With little in the way of major economic data and earnings season still a week away, the only major item of this past week was the deluge of Fed officials hitting the tape, including Chairman Powell’s testimony to the House and Senate on Wednesday and Thursday.
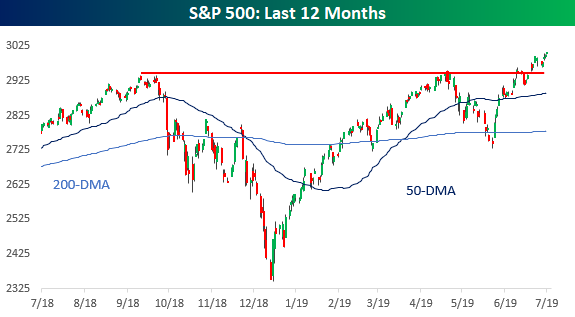
With the overall calm and Powell’s soothing words, bulls were in charge and took charge sending the major US large-cap indices to record highs. After numerous attempts to get through the 2,950 level, the S&P 500 finally broke out and hasn’t looked back since. With the S&P 500 up 20% on the year and earnings season coming up on the horizon where does the market stand and have we moved too far to fast?
In this week’s report, we’ll try to shed some light on that question by looking at the recent moves from a variety of angles including market internals, the setup for earnings season, how the economy is faring, and a look at sentiment and prior strong rallies. We cover everything you need to know as an investor in our weekly newsletter. To read the Bespoke Report and access everything else Bespoke’s research platform has to offer, start a two-week free trial to one of our three membership levels. You won’t be disappointed!
The Closer: End of Week Charts — 7/12/19
Looking for deeper insight on global markets and economics? In tonight’s Closer sent to Bespoke clients, we recap weekly price action in major asset classes, update economic surprise index data for major economies, chart the weekly Commitment of Traders report from the CFTC, and provide our normal nightly update on ETF performance, volume and price movers, and the Bespoke Market Timing Model. We also take a look at the trend in various developed market FX markets.
The Closer is one of our most popular reports, and you can sign up for a free trial below to see it!
See tonight’s Closer by starting a two-week free trial to Bespoke Institutional now!
B.I.G. Tips – Netflix (NFLX) Price Reaction to Earnings
Earnings Off-Season Stats
Earnings season encompasses a period of roughly six weeks every three months when the large majority of publicly traded companies report their quarterly numbers. The unofficial start to earnings season used to occur when Alcoa (AA) — a former Dow 30 stock — posted its quarterly numbers, as it was always the first big blue chip to report. In 2017, however, Alcoa (after spinning off part of the company) pushed back its quarterly earnings report date by a couple of weeks, so now we consider the unofficial start to earnings season to be when the first of the big Wall Street firms reports each quarter. This quarter, the start to earnings season will be on Monday, July 15th when Citigroup (C) reports. Click here to see our list of the most volatile stocks on earnings.
Wal-Mart’s (WMT) quarterly earnings report marks the unofficial end to earnings season. The Q1 2019 earnings reporting period ended when WMT reported back on May 16th.
Below we wanted to check up on how things went during the most recent earnings offseason. While the number of reports per day drops dramatically during the earnings offseason, there’s still a slow trickle of reports.
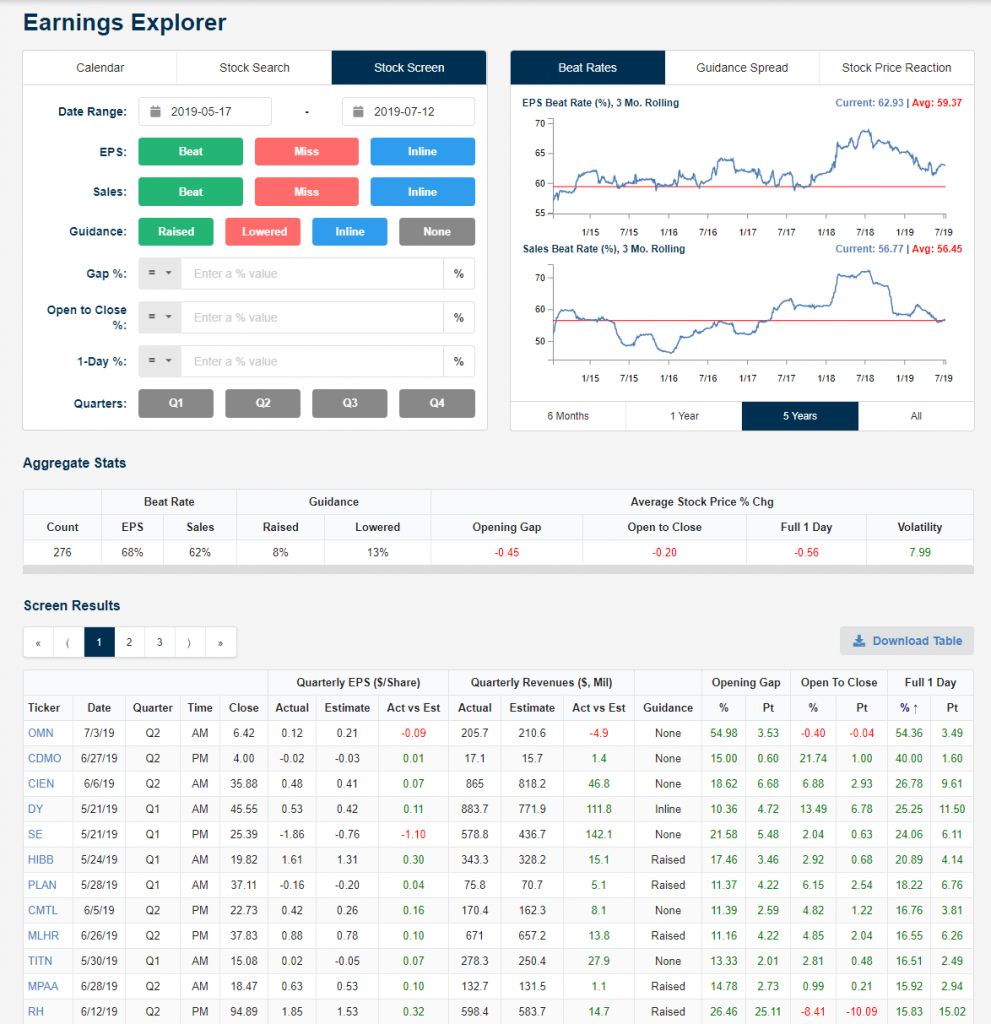
Bespoke subscribers have access to our Earnings Explorer tool that keeps investors on top of the important macro and micro trends related to earnings. Users can easily pull up historical quarterly reports for every US stock going back to 2001, and there’s a healthy amount of summary analysis as well. Below is a snapshot of the tool where we have pulled up all of the stocks that have reported since last earnings season ended on May 16th.
A total of 276 companies have reported earnings since May 16th. Sixty-eight percent of these companies reported better than expected EPS numbers, while 62% reported better than expected sales. In terms of guidance, only 8% of companies raised guidance while 13% lowered guidance. This means there was a guidance spread of -5 during the most recent earnings offseason.
In terms of price reaction to earnings, the average stock that has reported since May 16th has fallen 0.56% on its first trading day following its report. This negative price action from individual stocks in response to earnings is a divergence from the S&P 500’s gain of more than 4% during this offseason.
At the bottom of the snapshot, we show the stocks that performed best on their earnings reaction days this offseason. (Users of the tool see an interactive list of all 276 stocks that have reported along with their price action.) As shown, OMN was the best performing stock on earnings this offseason with a one-day gain of 54.36% on July 3rd. CDMO, CIEN, and DY all gained more than 25% on their earnings reaction days as well. If you haven’t used it yet, we urge you to try out our Earnings Explorer now. You can access it with a two-week free trial to Bespoke Institutional.
Earnings Season vs Earnings Off Season
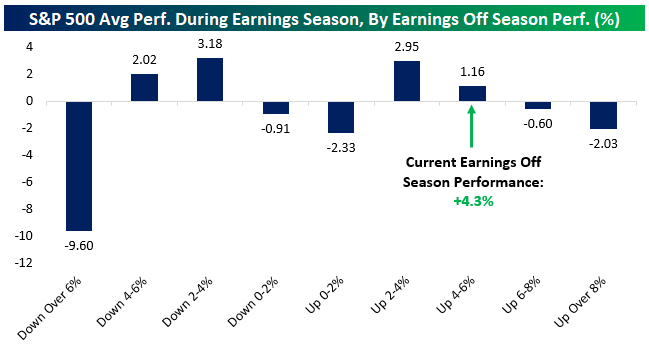
Earnings season is upon us. Historically, we used Alcoa (AA) reporting as the unofficial start of earnings season, but since that company broke into two tickers we’ve switched to the first report among the large money center banks. On Monday, that will be Citi (C). We gauge the report for Wal-Mart (WMT) as the unofficial end of earnings season. Since WMT’s most recent report, the S&P 500 is up about 4.3%. What does that tell us about forthcoming performance during earnings season?
As shown in the chart below, not much. Since 2001, stocks tend to perform best over earnings season when they’re either down modestly or up modestly in the prior off season. Very large or very small off season changes in stock prices tend to lead to the worst earnings season performance, while modest gains or losses in the off season lead to the biggest average gains.
It’s worth saying that if we don’t break up the performance into bins as we do in the chart above, the relationship between off season performance and earnings season performance is almost literally zero. While the 4.3% performance into earnings season this year suggests modest gains across earnings season, the broader data set doesn’t tell us much about where the stock market is set to go over the next six weeks. Start a two-week free trial to Bespoke Institutional for access to our full suite of reports dealing with seasonality, historical performance, and earnings results.
Breakouts to 52-Week Highs
At yesterday’s close, there were 271 stocks and ETFs that made a new 52-week high. We publish a list of new 52-week highs every day in our Chart Scanner tool, and looking through yesterday’s list, just about all of these names have been in strong uptrends in 2019 and are currently sitting at overbought or extremely overbought levels. The run up to 52-week highs for some of these names have come as a result of breaking longer-term resistance of a month up to over a year. Below are a handful of charts of these types of “breakout” stocks.
For some, the recent breakout was above longer-term resistance, as is the case for American International (AIG), Apollo Global Management (APO), and Dish Network (DISH). Two major US retailers, Home Depot (HD) and Target (TGT), also belong to this group. DISH is slightly different than these others in that it broke out above long term resistance a bit further back (in late June), but more recently came back to retest this former resistance as support. After a bounce off of these levels, the stock has rallied to reach another 52-week high.
The breakout for others comes after only a few months of consolidation. This is the case for Ally Financial (ALLY), Altice (ATUS), Chegg (CHGG), Copart (CPRT), and ONEOK (OKE). Similarly, stocks like CME Group (CME), Eversource (ES), Intuit (INTU), and MarketAxess (MKTX) all recently saw pullbacks after getting extended in their 2019 uptrends. Yesterday’s press back to 52-week highs has reconfirmed these uptrends. Start a two-week free trial to Bespoke Institutional to access our interactive Chart Scanner and much more.
Country Stock Markets See Downside Mean Reversion
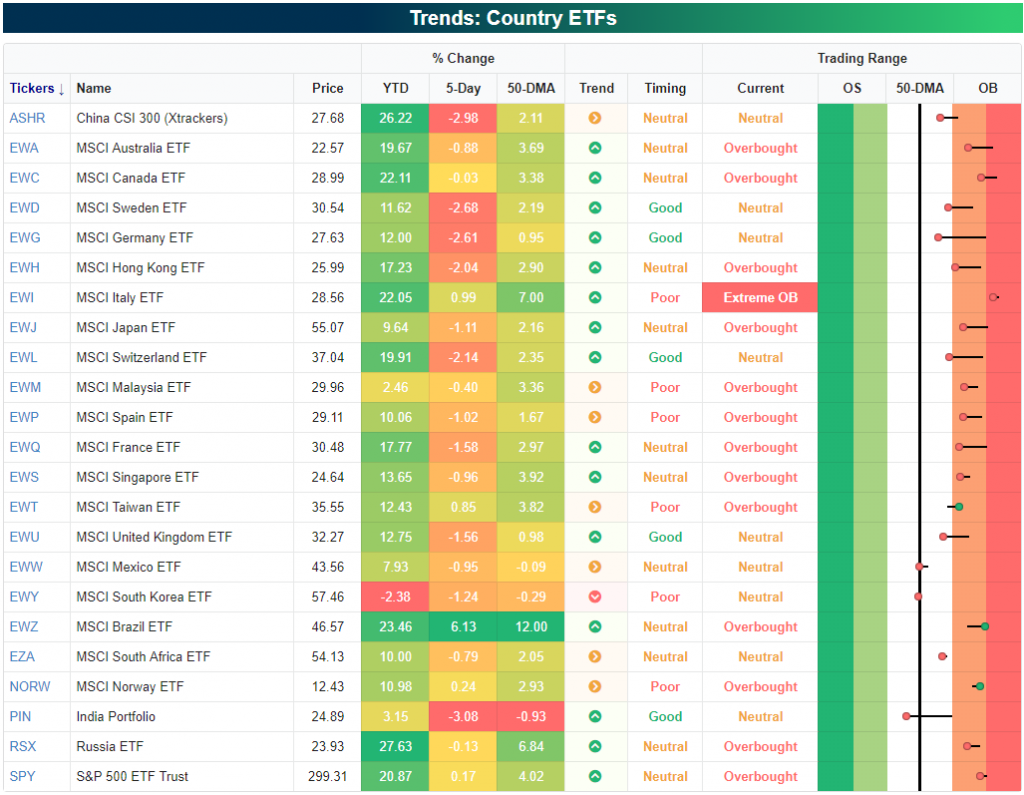
Yesterday we highlighted the year-to-date performance of stock markets for 75 countries around the world. Below is a snapshot of how 23 of the largest countries have been performing more recently relative to their normal trading ranges. While Brazil (EWZ) is up 6% and the US (SPY) is up slightly over the last 5 trading days, most countries are actually in the red. Given how extended a lot of countries were last week at this time, the action we’ve seen since then can be categorized as simple downside mean reversion.
While nearly all of these country ETFs are above their 50-day moving averages, there are three countries that have moved below — South Korea (EWY), Mexico (EWW), and India (PIN). India has shown the most weakness over the last week with a decline of more than 3%, leaving it 1% below its 50-DMA.
As mentioned earlier, Brazil (EWZ) has seen a huge move higher gaining 6% over the last week. The ETF is now 12% above its 50-day moving average, but remarkably, it’s still not even two standard deviations above its 50-DMA because of the big volatility the ETF typically experiences. Start a two-week free trial to one of Bespoke’s three premium subscription services for in-depth market analysis and actionable ideas on a daily basis.
Bespoke’s Morning Lineup – End of the Nightmare?
Is this the end of the long national nightmare? This morning’s release of the June PPI came in slightly higher than expected on both the headline and core readings, and that has sent US Treasury yields slightly higher moving the yield curve (10-year vs 3-month) out of inverted territory (for now). Just when everyone had written off inflation forever, CPI and PPI both came in higher than expected.
Read today’s Morning Lineup to get caught up on news and stock-specific events ahead of the trading day and a further discussion of overnight events in Asia and Europe.
Bespoke Morning Lineup – 7/12/19
As mentioned above, the yield curve has briefly moved out of inverted territory for the first time in 35 trading days. There’s still an entire trading day left to go, but if this trend holds, it’s the story of the day.

Start a two-week free trial to Bespoke Premium to see today’s full Morning Lineup report. You’ll receive it in your inbox each morning an hour before the open to get your trading day started.
The Closer – Sloppy Auction, Strong Spending, CPI Surge, Receipts Rock – 7/11/19
Log-in here if you’re a member with access to the Closer.
Looking for deeper insight on markets? In tonight’s Closer sent to Bespoke Institutional clients, we go over several factors that played into a brutal day for the bond market leading to a huge bear steepening at the long end of the curve. Namely, one of these factors was a very bad 30-year bond reopening which we look at the internals of. Next, we take a look at the strength of the consumer including the divergence between Bloomberg and other consumer sentiment indicators. After recapping today’s inflation data, we then give an updated look at the federal budget deficit.

See today’s post-market Closer and everything else Bespoke publishes by starting a 14-day free trial to Bespoke Institutional today!
