Daily Sector Snapshot — 8/22/25
NVIDIA (NVDA), Microsoft (MSFT) Charts
As the two largest companies in the world, NVIDIA (NVDA) and Microsoft (MSFT) account for more than 15% of the S&P 500. Needless to say, their performance and the way they’re trending has a big impact on the overall market.
Below is a check-up on their price charts, both short-term and long-term.
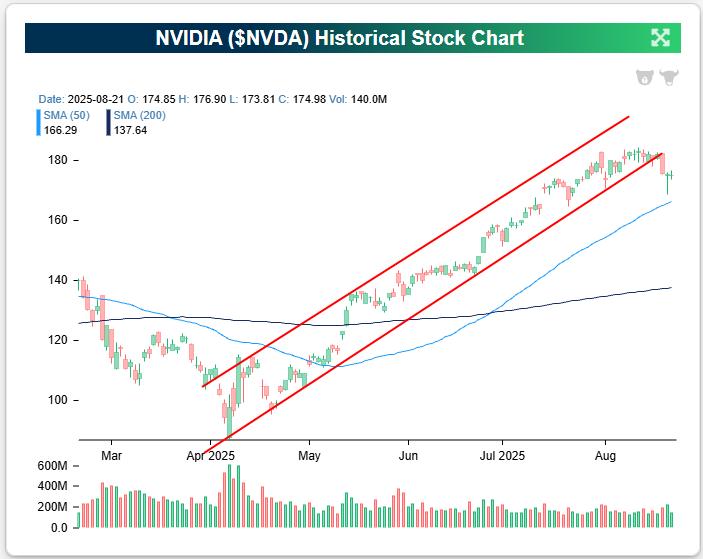
While the market is rallying sharply as of mid-day Friday following Fed Chair Powell’s Jackson Hole commentary that has so far been interpreted as dovish, the price action in the two biggest mega-caps hasn’t been great recently.
As shown below, both NVDA and MSFT had been trading in just about the tightest uptrend channels you could ask for in the months leading up to August, but those uptrends are now broken. The sellers were finally able to break the backs of the bulls this month just as we’re entering what has historically been the weakest month of the year from a seasonal perspective (September).
The broken uptrend for NVIDIA (NVDA) also comes just ahead of its Q2 earnings report due out next Wednesday (8/27) after the close.

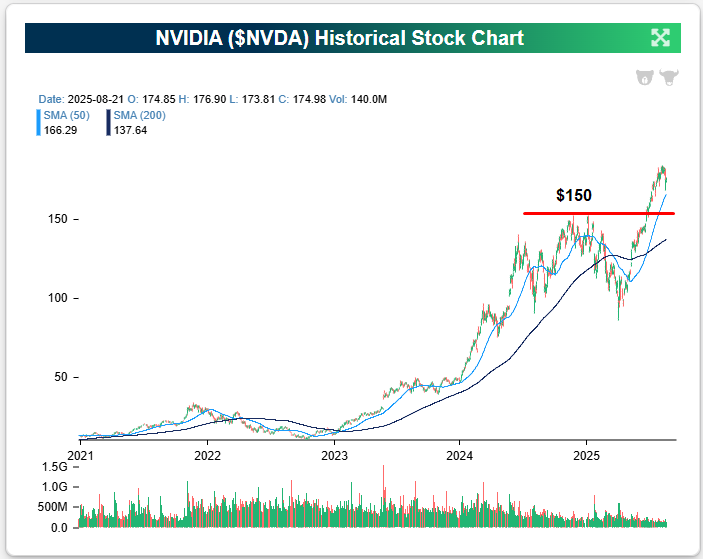
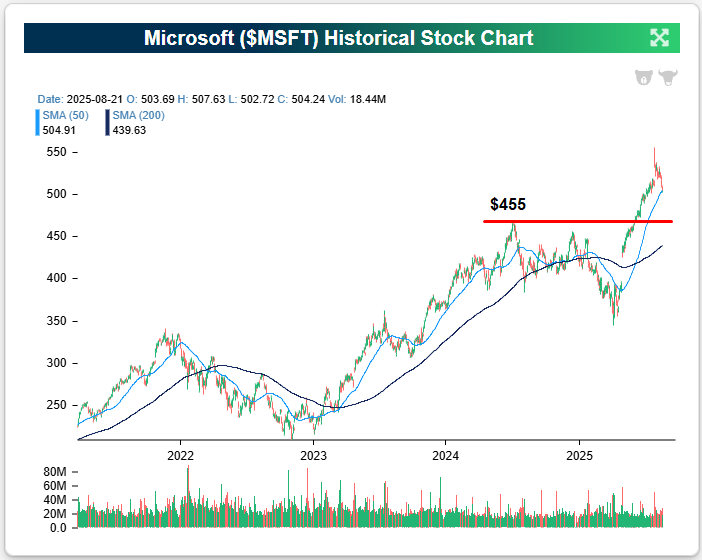
We don’t need to provide any more superlatives about the gains that both NVDA and MSFT have seen over the last five years, but a look at their long-term price charts can be helpful for identifying support levels should their short-term weakness turn into something deeper.
For NVIDIA (NVDA), its first big long-term support level is at $150, which represents its prior highs made at the end of 2024. That support is about $25 below where NVDA was trading coming into today.
For Microsoft (MSFT), its first major support level to keep an eye on is $455; also represented by its 2024 highs made last July. MSFT came into today trading a few dollars above $500/share, so a drop to support at $455 would represent a decline of about 10%.
We provide chart analysis of individual stocks and ETFs on a daily basis for Bespoke Premium subscribers. We also have unique charting tools available for subscribers like our Chart Scanner and Trend Analyzer. If you’ve never tried it out, we urge you to start a two-week Bespoke Premium trial today!

Bespoke’s Morning Lineup – 8/22/25 – Same Day of the Week, Different Sentiment
See what’s driving market performance around the world in today’s Morning Lineup. Bespoke’s Morning Lineup is the best way to start your trading day. Read it now by starting a two-week trial to Bespoke Premium. CLICK HERE to learn more and start your trial.
“There is winning and there is misery.” – Bill Parcells

Below is a snippet of commentary from today’s Morning Lineup. Start a two-week trial to Bespoke Premium to view the full report.
Futures are modestly higher heading into the last session of the week as the S&P 500 looks to end a five-day losing streak. There’s no economic data on the calendar, so whether we can end this streak will likely depend entirely on Powell’s 10 AM Jackson Hole speech.
In Europe, stocks are modestly higher on little in the way of news besides German GDP for Q2 being revised down more than expected to a decline of 0.3% versus forecasts for a decline of 0.1%.
In Asia, equities finished off a mixed week with a mixed session. Japan’s Nikkei finished slightly higher but down over 1% for the week. Chinese stocks were up over 1%, taking the weekly gain to more than 3%, while India traded down 0.9% on Friday but still managed to finish the week up nearly 1%. The main story out of the region was in China where Nvidia (NVDA) has reportedly stopped sales of its H20 chip to Chinese customers after that country’s government told local tech companies not to buy the chips citing security concerns. In response to the news, Chinese semiconductor names traded sharply higher.
It’s only been a week, but the general market tone heading into this Friday’s session is different than last Friday. For starters, we’re not sure where you are, but in the New York area, last Friday’s morning temperature was around 80 degrees, but this morning, we’re looking at a fall-like temperature of 58 degrees as we type this. In the equity market, last Friday, the S&P 500 was coming off its 3rd record closing high in a row and its 13th record high of the quarter. A rate cut at the next Fed meeting in September was pretty much a done deal.
Today, things look a lot less certain, the market is now pricing in just a 70% chance of a cut at the September meeting, and ahead of his Jackson Hole speech at 10 AM this morning, he probably won’t rule it out, but it doesn’t feel like Powell will make a forceful case to cut rates. With all the increased uncertainty, we’ve gone from a market closing at record highs to a 5-day losing streak that is tied for the longest since April 2024.
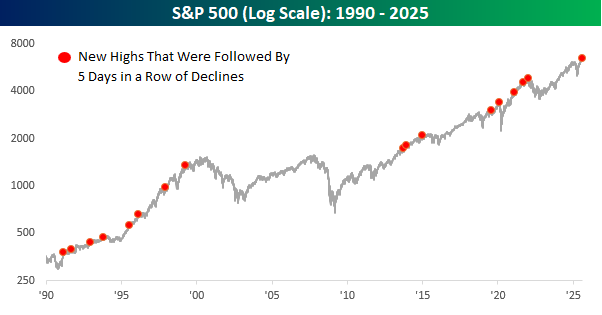
The last time the S&P 500 closed at a record high and then fell for five straight days was in January 2022 right at the start of the last bear market. There was also an occurrence right around the pre-Covid peak, and another near the dot-com peak in 2000. Any time you can make a connection between the current market and those three periods, it’s an ominous signal. Don’t they say that tops are a process? These all sound like pretty quick reversals!
Looking at ALL the occurrences where the S&P 500 hit a new high and then immediately went into a five-day losing streak, though, shows that there were plenty of occurrences within much longer-term bull markets.
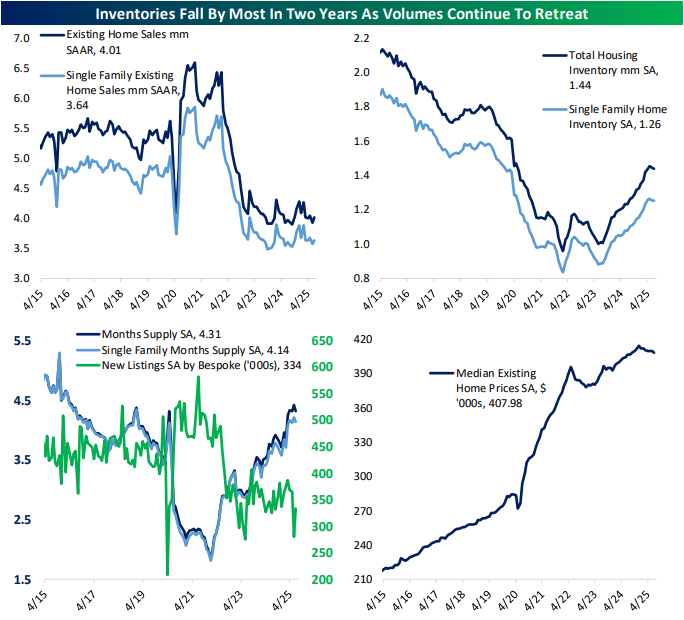
The Closer – Manufacturing Rebound, Claims Demographics, Home Sales – 8/21/25
Log-in here if you’re a member with access to the Closer.
Looking for deeper insight into markets? In tonight’s Closer sent to Bespoke Institutional clients, we begin with a rundown on the latest earnings reports and macro themes coming out of those earnings and Jackson Hole (page 1). Next, we check in on manufacturing PMIs (pages 2 and 3) before pivoting over to claims data (pages 3 – 5). We round out tonight’s report with an update on existing home sales (page 6).
See today’s full post-market Closer and everything else Bespoke publishes by starting a 14-day trial to Bespoke Institutional today!
Bespoke’s Weekly Sector Snapshot — 8/21/25
Q2 2025 Earnings Conference Call Recaps: Walmart (WMT)
Bespoke’s Conference Call Recaps use AI to summarize lengthy earnings calls. The commentary below is AI-generated and then edited by Bespoke for quality control. As always, none of these summaries should be construed as recommendations to buy or sell any securities, and investors should do their own research and/or consult with a financial professional before making any investment decisions.
Our latest recap available to Bespoke subscribers covers Walmart’s (WMT) Q2 2026 earnings call.
![]()
Walmart (WMT) is the world’s largest retailer, operating supercenters, neighborhood markets, Sam’s Club warehouses, and a rapidly growing e-commerce platform. It serves over 250 million customers weekly across the US and 18 countries, offering everything from groceries and apparel to electronics and pharmaceuticals. Walmart posted 5.6% constant-currency sales growth, driven by 26% US e-commerce growth, a 6% Sam’s Club comp, and 10.5% international growth (China +30%, Walmex +6%). Delivery speed is a standout: one-third of orders arrived in under 3 hours, 20% in under 30 minutes. Tariffs remain a headwind, yet Walmart expanded rollbacks to 7,400 items, up nearly 2,000 from Q1, with grocery rollbacks up 30%. Consumer resilience was mixed: higher-income households fueled share gains, while middle and lower-income cohorts traded down. Advertising revenue surged 46% globally, membership income rose 15%, and the marketplace grew 17%. AI dominated discussion, with “Sparky” and other super-agents set to transform shopping, associates’ work, and supplier tools. On mixed results, WMT shares tumbled more than 5% on 8/21…
Continue reading our Conference Call Recap for WMT by becoming a Bespoke Institutional subscriber. You can sign up for Bespoke Institutional now and receive a 14-day trial to read our newest Conference Call Recap. To sign up, choose either the monthly or annual checkout link below:
Chart of the Day: Health Care, Sick Or Hearty?
Best and Worst: Be Careful What You Wish For
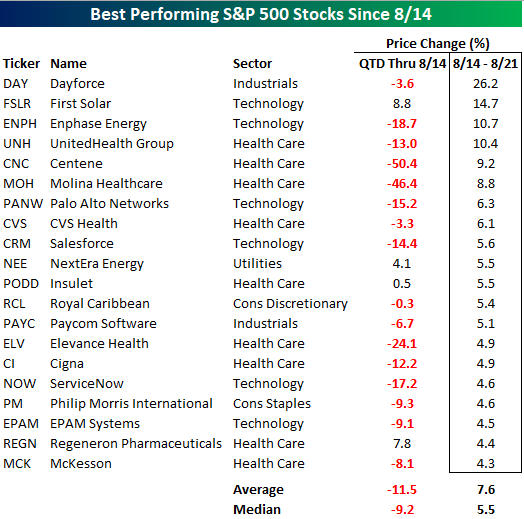
With the S&P 500 on pace for a five-day losing streak, several investors are probably looking at losses in their portfolios, and then looking over at the stocks that have been rallying and wondering why they don’t own those. One good answer is that outside of the last week, they were terrible! The table below lists the 20 best-performing stocks in the S&P 500 over the last week. Overall, the 20 stocks listed are up an average of 7.6% (median: 5.5%). At the sector level, nine of them come from the Health Care sector, and another six come from the Technology sector. The remaining five are spread out across four different sectors. What stands out, though, is that the 20 best-performing stocks over the last five days have been terrible performers so far in the quarter. From the end of June through 8/14, they declined an average of 11.5% (median: -9.2%), and only four were up. So, sure, owning them over the last week would have been nice, but you weren’t having a very good summer before the last five trading days.
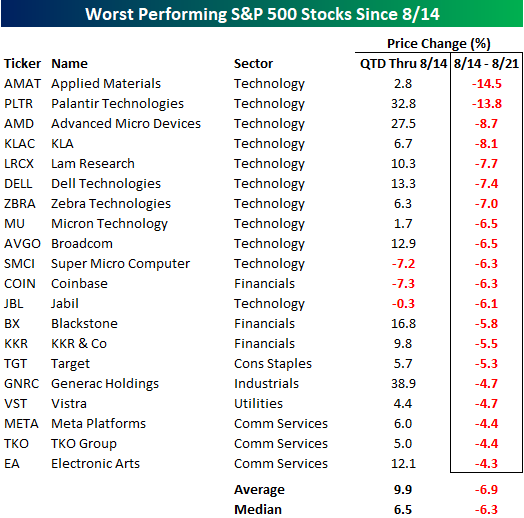
Conversely, the worst 20 performers since the S&P 500’s losing streak started had seen strong gains QTD through 8/14. As shown in the table below, their average gain was 9.9% (median: +6.5%), and only three were down. At the sector level, more than half of the worst performers over the last five trading days are all from the Technology sector, including the ten worst performers!

Bespoke’s Morning Lineup – 8/21/25 – On the Mend?
See what’s driving market performance around the world in today’s Morning Lineup. Bespoke’s Morning Lineup is the best way to start your trading day. Read it now by starting a two-week trial to Bespoke Premium. CLICK HERE to learn more and start your trial.
“Solving big problems is easier than solving little problems.” – Sergey Brin
Below is a snippet of commentary from today’s Morning Lineup. Start a two-week trial to Bespoke Premium to view the full report.
Futures are set for another lower open this morning, just as the Fed kicks off its annual Jackson Hole symposium and tomorrow’s speech by Fed Chair Powell. Shares of Walmart (WMT) are down close to 4% after the company reported weaker-than-expected EPS. If the stock closes down today, it would mark the third consecutive negative reaction to earnings, the longest such streak since 2021. Outside of WMT, the earnings calendar is relatively quiet this morning, but it’s a busy day for economic data, with jobless claims (higher than expected) and the Philly Fed (weaker than expected) at 8:30, PMIs at 9:45, and then Leading Indicators and Existing Home Sales at 10:00 AM.
The weakness in US futures follows what has been a weak morning in Europe, where the STOXX 600 is down 0.3% while Asian stocks were mixed, with Japan falling 0.7% and China, India, and South Korea all finishing the session with modest gains.
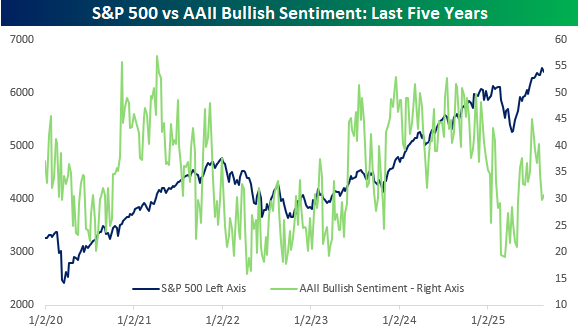
A four-day losing streak for the S&P 500 hasn’t done much to improve what has already been subdued sentiment on the part of individual investors. In this week’s survey from AAII, bullish sentiment rose slightly to 30.8% from 29.9% but with the S&P 500 within 2% of 52-week highs, investors aren’t happy. As shown in the chart below, a similar divergence emerged between equities and bullish sentiment earlier in the year, right before the market started to unravel. Then again, from early in 2021 and throughout the year, sentiment steadily deteriorated while the market just marched higher.
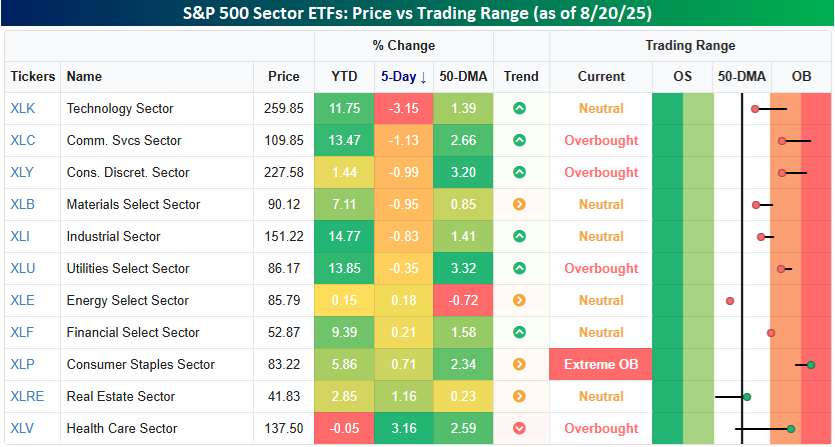
It’s been a mixed picture in terms of sector performance over the last week. Technology (XLK) has been the biggest loser, declining 3.2%, moving it out of overbought territory. Besides tech, the only other sector down more than 1% is Communication Services (XLC), while Consumer Discretionary (XLY) and Materials (XLB) are down just shy of a percent. At the other end of the spectrum, it has been defensive sectors holding up the best, just as you would expect during a market pullback. Health Care (XLV), the only sector down YTD, is up 3.2% while Real Estate (XLRE) and Consumer Staples (XLP) are the only two other sectors that have gained more than half a percent.
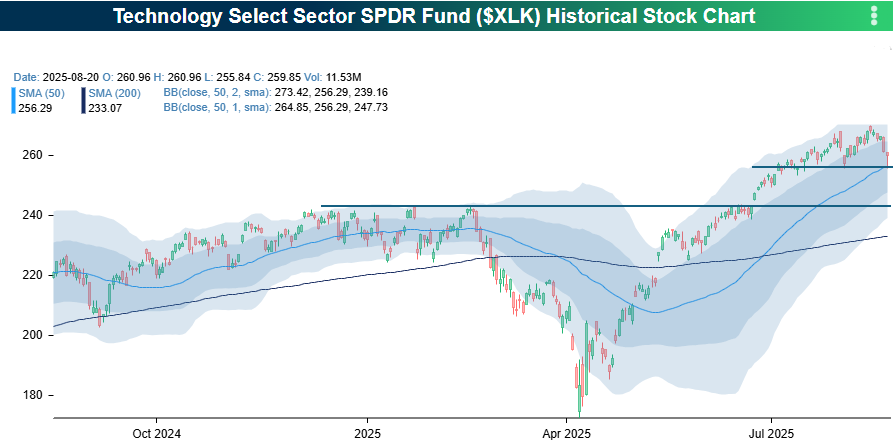
Looking at the Tech sector, at one point in yesterday’s sell-off, it tested its 50-day moving average and short-term support that coincides with other low points since the start of the second half. If these levels don’t hold, the next area to look at would be the high from earlier in the year, right before markets started to roll over. Those levels are about 7% below yesterday’s close.
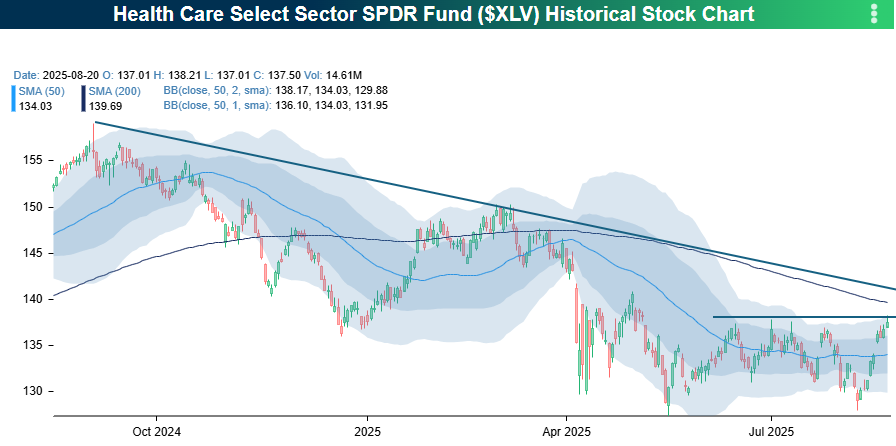
Health Care has been a completely different animal. After testing support near 52-week lows last week, the sector has now rallied back to the high end of its post-Liberation Day range. If it can break through those short-term resistance levels, the next areas to watch will be the 200-DMA, which is about 1% above yesterday’s close. After that, the downtrend line in place for a year now would be the next area to watch. If the sector can break through all these levels, we may finally be able to say that the sector is on the mend!
The Closer – For Cause, Breadth, Momentum MACD – 8/20/25
Log-in here if you’re a member with access to the Closer.
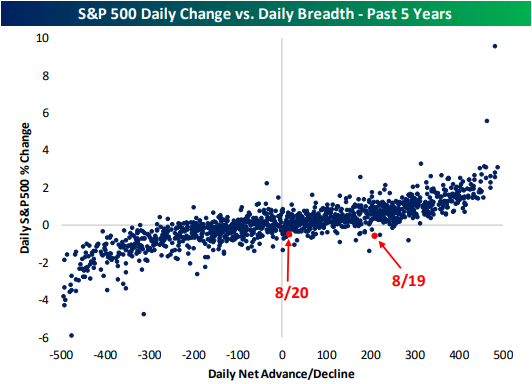
Looking for deeper insight into markets? In tonight’s Closer sent to Bespoke Institutional clients, we begin with an update on the latest drama surrounding the administration and FOMC (page 1). Next, we review the Fed Minutes and deciles of intraday performance today (page 2). After that, we highlight the back-to-back days of declines on positive breadth (page 3) before closing out with a rundown on breadth in MACD lines (page 4).
See today’s full post-market Closer and everything else Bespoke publishes by starting a 14-day trial to Bespoke Institutional today!