B.I.G. Tips – Ten Year Price Charts
Bespoke’s Morning Lineup – 3/17/20 – Market Could Use a Little Luck
See what’s driving market performance around the world in today’s Morning Lineup. Bespoke’s Morning Lineup is the best way to start your trading day. Read it now by starting a two-week free trial to Bespoke Premium. CLICK HERE to learn more and start your free trial.
When the only thing you have left to fall back on is a little luck, things are bad out there. Futures were limit up at one point overnight, but those gains have faded as we near the close. Conditions in the credit markets aren’t faring as well, though. Despite all of the central bank actions over the last several days, credit spreads continue to widen.
Retail Sales were just released and came in much weaker than expected (-0.5% vs +0.2%), so despite all that shopping at Costco and stores like that as consumers stocked up on supplies, the overall total was weak.
Read today’s Bespoke Morning Lineup for a discussion of overnight moves in the credit markets, the latest stimulus plans coming out of Washington, and the trading in Asia and Europe.

Normally, when the equity market reaches extreme overbought or oversold levels it doesn’t stay that way for long. That hasn’t been the case recently, though, as the S&P 500 has been consistently at extreme oversold levels for a number of days now. There’s only so much time that the market or investors can stand these types of oversold readings.

The Closer – Washington Wakes Up – 3/16/20
Log-in here if you’re a member with access to the Closer.
Looking for deeper insight on markets? In tonight’s Closer sent to Bespoke Institutional clients, we review the historic session as DC makes plans to provide stimulus to the American public. We then show what the drop in GDP could look like as a result of Covid-19. Next, we the massive move in the S&P 500 and dollar as well as the normalization in Treasury markets. We finish with a look at just how bad breadth has been in the past couple of weeks.
See today’s post-market Closer and everything else Bespoke publishes by starting a 14-day free trial to Bespoke Institutional today!
Daily Sector Snapshot — 3/16/20
B.I.G. Tips – Historic Volatility
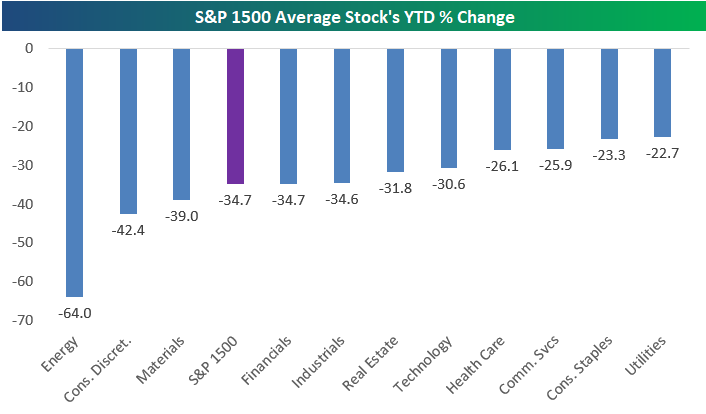
S&P 1500 Sector Declines
The average S&P 1500 stock is now down more than 25% month-to-date, 35% year-to-date, and 44.5% from its 52-week high. Below is a look at the carnage across S&P 1500 sectors. Start a two-week free trial to Bespoke Institutional to access our full suite of research and interactive tools.


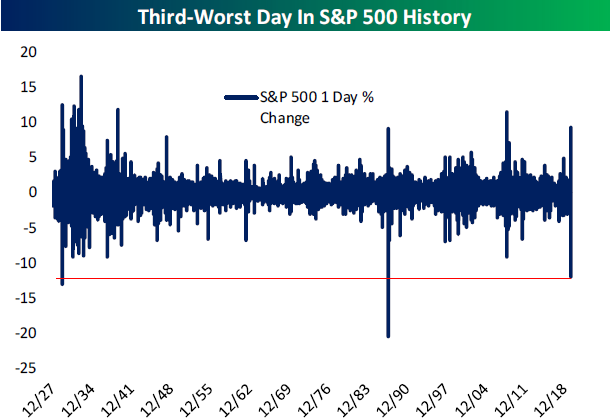
S&P 500 Drawdowns From Record Highs
With US equities down another 10% today, the S&P 500 is moving increasingly closer to reaching the threshold of a 30% decline. As of this afternoon, the S&P 500 is down 26.7% from its record high less than one month ago. The chart below shows S&P 500 drawdowns from record closing highs since the start of 2000. The last twenty years have really been a period to behold for US equities. Even though it includes one of the longest bull markets in history, the S&P 500 has seen drawdowns of 49.1%, 56.8%, and now 26.9%. Start a two-week free trial to Bespoke Institutional to access our full suite of research and interactive tools.

Fall of the Empire
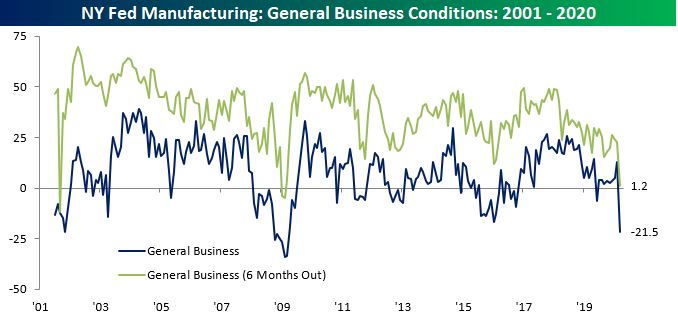
One of the first big drops in US economic data showed its face today in the form of the first of the regional Fed indices covering the month of March. The NY Fed’s headline reading on general business conditions experienced it largest drop on record in March, falling 34.4 points from 12.9 in February to -21.5. That is the first negative reading since June of last year, but the lowest level of the index for current conditions since March of 2009 during the financial crisis. Back then, the index remained below -20 for six consecutive months. Prior to then, the only similar readings can be found early in the survey’s history in November of 2001.
As for expectations six months out, this month’s reading of 1.2 is again the lowest reading since early 2009, and as with the current conditions index, you would need to go back to 2001 to find similarly low readings before that. The 21.7 point decline in expectations this month is also the largest one month decline since January 2009 when it dropped by slightly more (24.9 points). Overall, New York area businesses’ outlook in both the near term and further out have deteriorated dramatically in just one month.
Of the individual components, pretty much everything was weaker this month for both current conditions and expectations. Only two categories (expectations for unfilled orders and inventories) rose this month. Other than the headline index, the two categories who’s declines stand out the most, and likely drove the large declines for the headline number, are for new orders and shipments. While other categories’ declines are much more modest by comparison, they too are significant nonetheless.

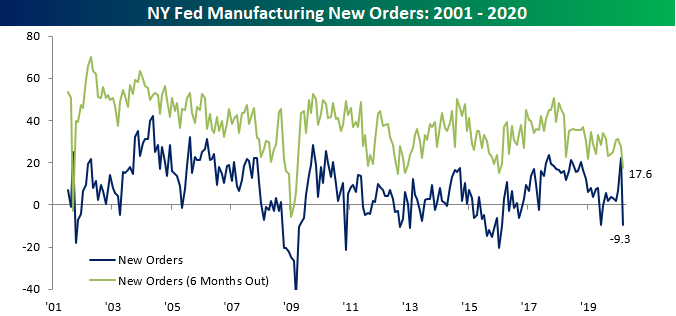
The index for new orders fell from 22.1 last month to -9.3. This was slightly lower in June of last year when it had fallen to -9.7, but the 31.4 point month-over-month decline was the third largest on record behind October of 2001 (43.2 point drop) and November of 2010 (31.8 point drop). With current demand drying up, expectations for the future are also weak as the index for expectations six months out fell to 17.6 from 27.5 in February. While this does not draw parallels to the financial crisis like other aspects of this month’s survey, this is the lowest level since January 2016.
Given the weaker demand, the index for shipments has also come down a lot. The current conditions index for shipments is in negative territory, -1.7, for the first time since October of 2016. The 20.5 point decline from last month is the largest decline since August of 2015. As for the forward looking indicator, conditions have not fallen off of a cliff in the same way, but are at the low end of the past several year’s range. Now at 20.5, it is at its lowest level since only October.

Weekly jobless claims have been one economic indicator that have been closely watched over the past several weeks given their higher frequency and potentially more timely reading on the impacts of Covid-19 on the American workforce. While nothing has shown up there, the NY Fed’s indices for number of employees and average workweek have turned lower. The index for number of employees has been significantly lower multiple times in the past few years making the drop to -1.5 nothing too crazy, but the 8.1 point decline was the largest in over a year. Meanwhile, expectations for increasing the number of workers six months out is at its lowest level since 2017. Not only are NY area businesses not taking on more workers, but the index for average workweek fell to -10.9 which is the lowest level since December 2015. Start a two-week free trial to Bespoke Institutional to access our interactive economic indicators monitor and much more.

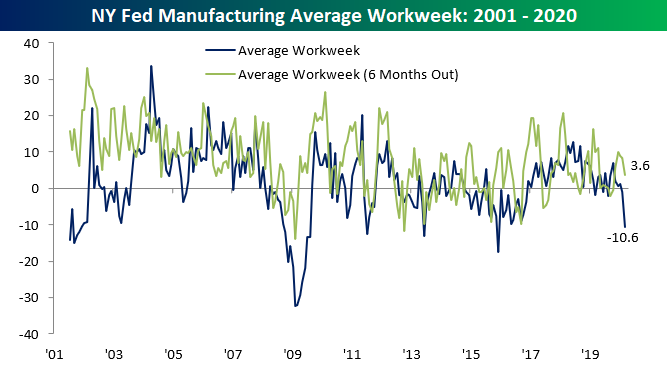
Chart of the Day: Largest-Ever SPY Gaps Down
Bespoke’s Morning Lineup – 3/16/20 – Off the Charts
See what’s driving market performance around the world in today’s Morning Lineup. Bespoke’s Morning Lineup is the best way to start your trading day. Read it now by starting a two-week free trial to Bespoke Premium. CLICK HERE to learn more and start your free trial.
Despite unprecedented stimulus from the Federal Reserve last night, US and global equity futures are trading limit down while US Equity Index ETFs are trading down roughly 10%. In fixed income markets, which were extremely stressed last week, conditions have shown some signs of not getting any worse, but major problems remain as the US economy and economies of countries around the world have essentially clogged to a halt.
Read today’s Bespoke Morning Lineup for a discussion of all the Fed’s moves, the troubling increases in Covid-19 cases in Europe, and a look at how the FOMC’s actions have impacted credit markets.
The chart below is from page two of today’s Morning Lineup and shows where sectors finished off last week relative to their trading ranges (as measured by standard deviations below their 50-DMA). The circle shows where each sector most recently closed and the tail shows where it closed a week ago. Finally, the boundary for each sector is three standard deviations above or below their 50-day moving average.
Even after Friday’s monster rally in the final minutes of trading all but one sector (Technology) was at least two standard deviations below its 50-DMA. With US equities on pace to open down by roughly 9% today, many of these sectors will likely be going off the charts once again.
