Daily Sector Snapshot — 3/20/26
Post-Iran Winners: Oil, Energy, and Israel
Equities around the world continue to take it on the chin this March, with month-to-date performance coinciding with the beginning of the start of the war in Iran over the last weekend of February.
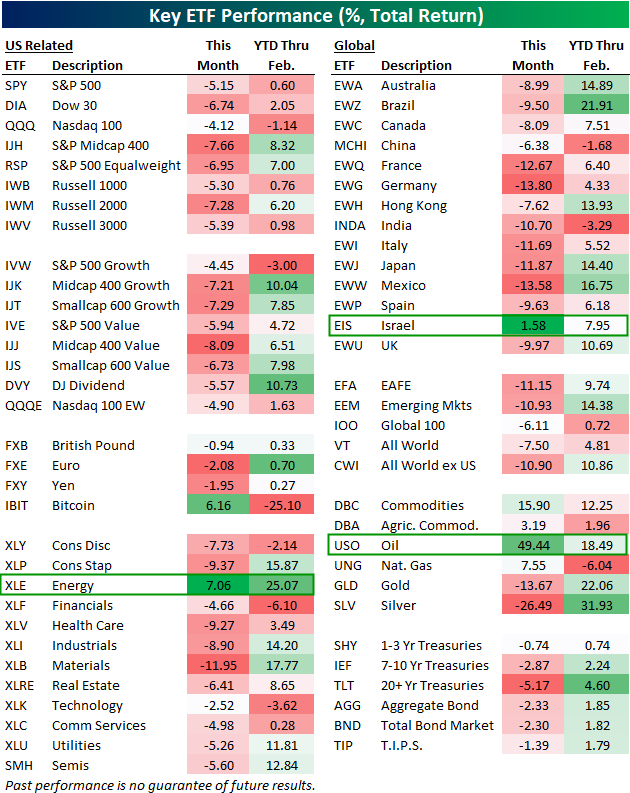
Below is a look at our asset class performance matrix featuring total returns for dozens of ETFs across domestic and international equities, sectors, currencies, commodities, and fixed income.
For each ETF, we show year-to-date performance through February along with performance so far in March.
ETFs across asset classes are bleeding red this month with the exception of a few: Bitcoin (IBIT), the Energy sector (XLE), oil (USO) and other energy/ag commodities, and Israel (EIS). Of these month-to-date winners, oil (USO), the agriculture commodities ETF (DBA), the Energy sector (XLE), and Israel (EIS) are the only ones that were also up year-to-date before the Iran war began.
On the downside, mid-caps and small-caps have been some of the hardest hit domestic index ETFs, with mid-cap value (IJJ) down the most at -8.1%.
Every sector ETF is down this month except Energy (XLE), with Materials (XLB) down the most at -12%.
Outside the US, country ETFs like France (EWQ), Germany (EWG), India (INDA), Italy (EWI), Japan (EWJ), and Mexico (EWW) are all down 10%+ since the war, while gold (GLD) and silver (SLV) have also gotten pummeled. Additionally, fixed income has not offered any safety due to inflation concerns brought about by the war. The 20+ Year Treasury ETF (TLT) is already down 5.2% since the bombings began.
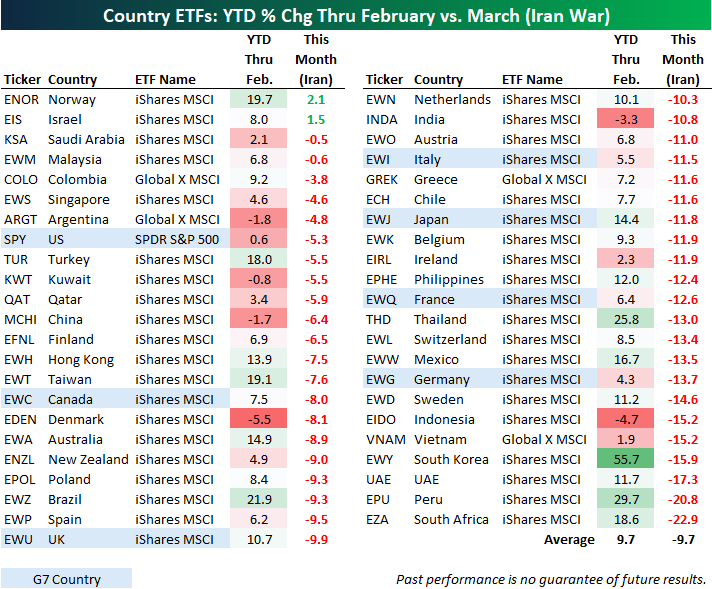
Below is a look at the recent performance of more than 40 country stock market ETFs traded on US exchanges.
On average, these country ETFs were up 9.7% through the first two months of 2026. Since the end of February, though, they’re down an average of 9.7%. Just a few weeks ago, it looked like 2026 was likely to be another year of outperformance for international markets. Now that there’s war in the Middle East and the Strait of Hormuz is unofficially closed for business, countries that heavily rely on energy imports are getting hit (with the exception of Israel). Along with Israel (EIS), Norway (ENOR) is the only other country ETF that’s positive this month. As a reminder, Norway is one of the few non-Middle Eastern countries that’s a net exporter of oil.
Six country ETFs are down 15%+ since the war began: Indonesia (EIDO), Vietnam (VNAM), South Korea (EWY), UAE (UAE), Peru (EPU), and South Africa (EZA).
Of the G7 countries, the US (SPY) is down the least with a decline of 5.3%, followed by Canada (EWC) — down 8%, and the UK (EWU) — down 9.9%.
Like this analysis? Become a Bespoke Premium member today using our March Madness special! Click below for details on how to sign up:

“Sir, We’re Going to Need a Bigger Rabbit”
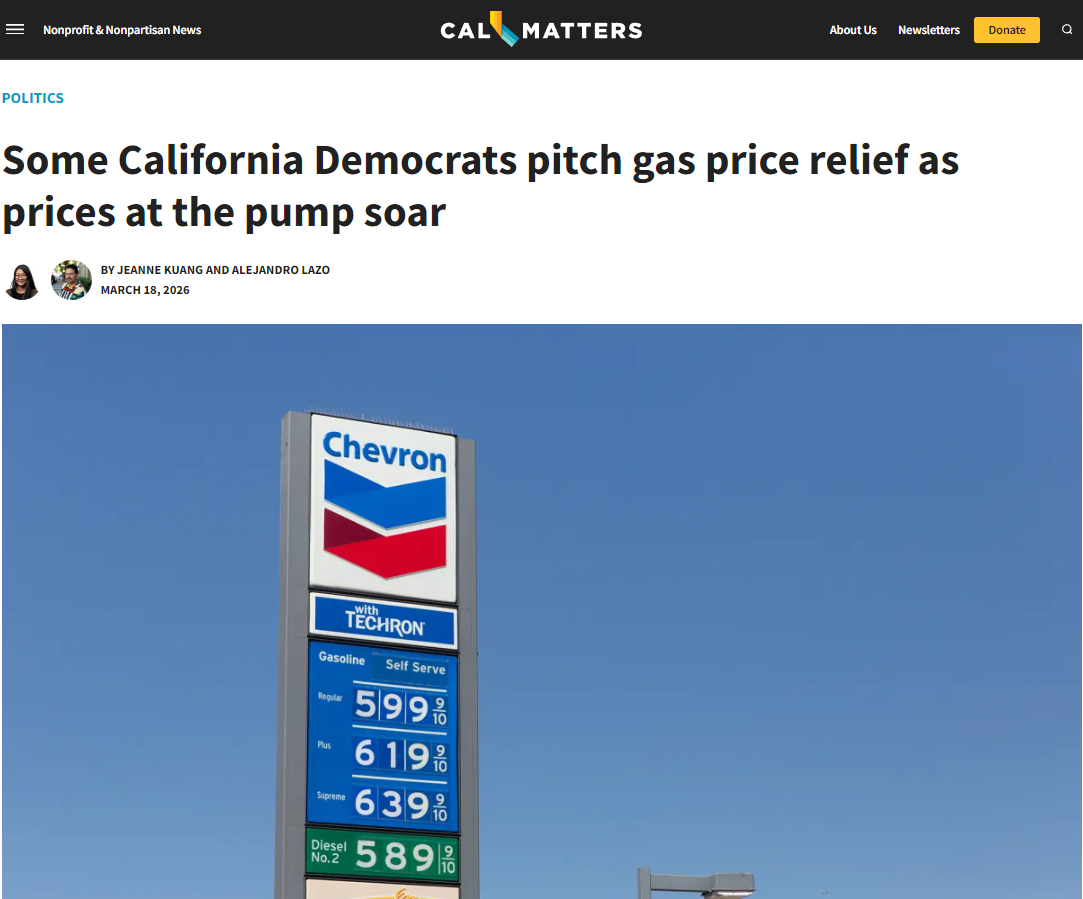
Memorial Day weekend and the beginning of the summer driving season is barely more than two months away. Were you planning a road trip? Well, maybe you’re starting to have second thoughts. Gas prices around the country have surged, and at times like this, the pictures from California always get the most attention. While we’ve seen pictures of even higher prices, the one below pretty much encapsulates what you’ll pay in the high gas price capital of the continental US. With prices reaching $6/gallon for the “cheap stuff”, shelling out $100 each time you go to get gas is now the norm. That’s before snacks, drinks, and the obligatory scratch-offs!
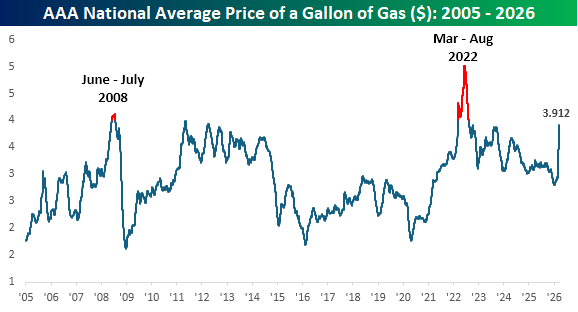
Obviously, California is not the norm. On a national basis, the average price of a gallon of gas, according to AAA, is still at $3.91 and will likely tip above $4 by early next week. Since the start of 2005, only two other periods have seen prices top $4. The first was from June to July of 2008, just as the Financial Crisis was accelerating. Then, in April 2022, after Russia invaded Ukraine, prices shot up to near $5 and stayed above $4 through early August.
The US consumer isn’t nearly as exposed to energy in terms of their total spending as they have been in decades past, but $4 still hurts. In 2008, the US economy experienced one of the deepest recessions in its history, and while the economy didn’t tip into a recession in 2022, GDP did turn negative, and stocks were in a bear market.
Besides filling up the tank, rising energy prices are showing up in other areas, notably airfares. So, if you thought the TSA security lines, which are growing longer by the day due to the shutdown, were a slap in the face, now you get to pay much more for the privilege of flying.
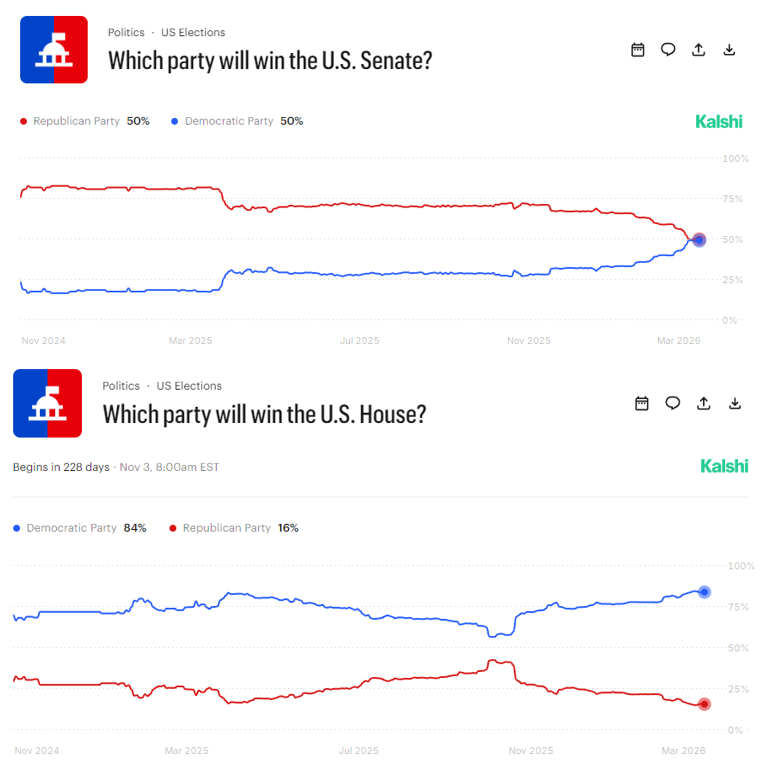
Between rising energy prices and a government shutdown that politicians have little urgency to end, if you’re up for re-election this year, good luck. This year, that spells trouble for Republicans. While it’s been widely assumed that Democrats would regain control of the House for some time now, in recent weeks, prediction markets have seen those odds increase to the highest levels since the last Presidential election (lower chart).
The picture in the Senate (top chart) is more interesting. While Republicans have largely been expected to maintain control after the midterms, in the last several days, prediction markets are now a toss-up for the Senate and moving in the wrong direction for the GOP. Whatever your political leanings, if you think that DC has been dysfunctional in terms of getting things done for the last year, just wait until next year if Democrats take control of both chambers of Congress. President Trump has shown an ability to pull rabbits out of his hat in the past, but as the midterms inch closer and gas prices sprint higher, the longer this trend persists, the bigger the bunny he’s going to need to pull out of his hat.
Like this analysis? Become a Bespoke Premium member today using our March Madness special! Click below for details on how to sign up:
The Triple Play Report: 3/17/26 – 3/19/26
An earnings triple play is a stock that reports earnings and manages to 1) beat analyst EPS estimates, 2) beat analyst sales estimates, and 3) raise forward guidance. You can read more about “triple plays” at Investopedia.com where they’ve given Bespoke credit for popularizing the term. We like triple plays as an indication that a company’s business is firing on all cylinders, with better-than-expected results and an improving outlook. A triple play is indicative of positive “fundamental momentum” instead of pure fundamentals, and there are always plenty of names with both high and low valuations on our quarterly list.
Bespoke’s Triple Play Report covers what each company does, what this quarter’s results say about their growth outlooks, and their histories of delivering triple plays. Bespoke’s Triple Play Report is available at the Bespoke Institutional level only. You can sign up for Bespoke Institutional now and receive a 14-day trial to read today’s Triple Play Report. To sign up, choose either the monthly or annual checkout link below:
Bespoke Institutional – Monthly Payment Plan
Bespoke Institutional – Annual Payment Plan
Bespoke Investment Group, LLC believes all information contained in these reports to be accurate, but we do not guarantee its accuracy. None of the information in these reports or any opinions expressed constitutes a solicitation of the purchase or sale of any securities or commodities. This is not personalized advice. Investors should do their own research and/or work with an investment professional when making portfolio decisions. As always, past performance of any investment is not a guarantee of future results. Bespoke representatives or clients may have positions in securities discussed or mentioned in its published content.
Bespoke’s Morning Lineup – 3/20/26 – Stocks, A Port in the Storm
See what’s driving market performance around the world in today’s Morning Lineup. Bespoke’s Morning Lineup is the best way to start your trading day. Read it now by starting a two-week trial to Bespoke Premium. CLICK HERE to learn more and start your trial.
“The longest way must have its close – the gloomiest night will wear on to a morning.” ― Harriet Beecher Stowe

Below is a snippet of commentary from today’s Morning Lineup. Start a two-week trial to Bespoke Premium to view the full report.
A negative week is on pace to finish with a negative session as the S&P 500 looks to finish lower for the fourth week in a row and the sixth down week in the last seven. S&P 500 and Nasdaq futures are both down about 0.5% but off their overnight lows. Where we close, though, will depend almost entirely on the price of oil, which is down 1% to $95.15 per barrel. Treasury yields are modestly higher, with the 10-year yield just under 4.3%, while gold is up 1.3% and Bitcoin is holding above $70K.
In Asia overnight, most major equity indices in the region were lower, although the KOSPI rallied 0.3% to finish up 5.4% for the week. In Europe, we’re seeing more muted performance to close out the week. The STOXX 600 is down 0.1%, which would put it down more than 2% for the week, but Spain has bucked the negative trend, rallying 1% today and putting it into positive territory for the week.
There’s no economic or major earnings data on the calendar today, so geopolitical headlines will dictate the market’s performance.
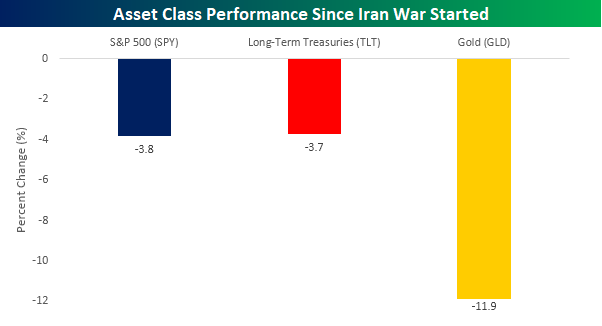
Heading into today’s session, the S&P 500 is down nearly 4% this month, which is unsurprising given the war in the Middle East. It’s only natural in times of geopolitical uncertainty for investors to move out of riskier assets into the safety of treasuries or even gold, the ultimate port in geopolitical storms. So, how are those two asset classes doing this month? Long-term treasuries, as proxied by the iShares 20+ Year Treasury ETF (TLT), are down 3.7%, which is basically in line with the S&P 500, while gold (GLD) is down more than triple either of the other two, with a decline of 11.9%. Just when you think you have it all figured out.
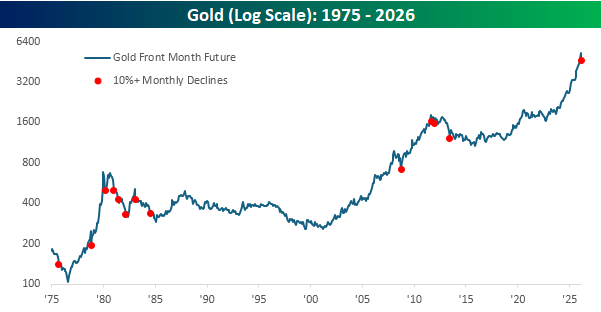
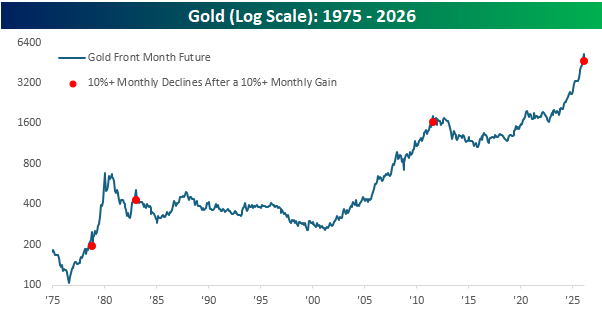
Gold’s double-digit percentage decline this month is on pace for the largest monthly decline in the commodity since June 2013 and, if it holds, would rank as the eighth largest one-month decline in gold since at least 1975. What’s even more interesting is that this month’s decline follows a double-digit percentage gain in February.
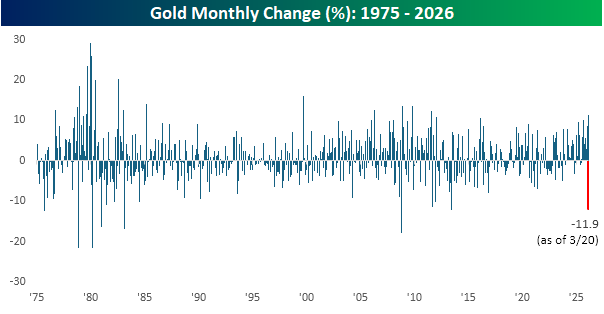
The chart below shows gold’s performance since 1975, and each red dot shows months when it declined 10% or more. Most of these declines occurred either early on or well into longer-term downtrends. There were some exceptions, though. The decline in October 2008 occurred right near the low for that period, and after the decline in November 1978, gold more than tripled over the next year.
Looking at just the periods when gold declined by at least 10% following a double-digit percentage gain. Here, the sample size is much smaller, with just three other occurrences. The two most recent, in 2011 and 1983, were followed by years of weakness, while the one other occurrence in 1978 was the one period where gold quickly tripled.
The Closer – Mystery Charts, Sector Streaks, Flow of Funds – 3/19/26
Log-in here if you’re a member with access to the Closer.
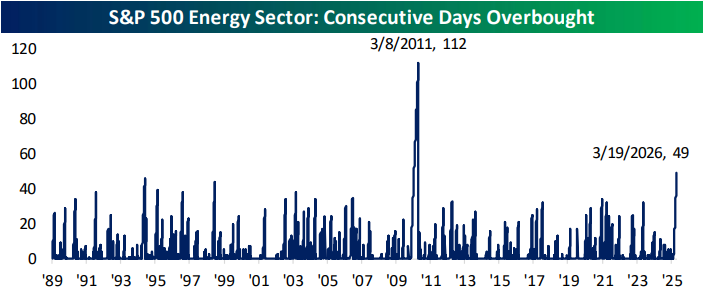
- The Energy sector has now traded in overbought territory for 49 consecutive trading days; the second longest streak of overbought readings on record.
- Intraday, crude oil futures continue to be driven by extreme lurches in positioning and weak liquidity.
- Data from the Federal Reserve’s Flow of Funds report showed that the corporate financing gap remains negative despite the boom in AI investment.
See today’s full post-market Closer and everything else Bespoke publishes by starting a 14-day trial to Bespoke Institutional today!
Bespoke’s Weekly Sector Snapshot — 3/19/26
Powell Performance – Winners and Losers Since Fed Chair Began
The S&P 500 fell 1.36% on Fed Chair Powell’s penultimate FOMC day on Wednesday (3/18/26). While a hallmark of Powell’s tenure as Chair has been the stock market’s tendency to trade sharply lower in afternoon trading on Fed Days, the market has also done very well over the entirety of his 8+ year term.
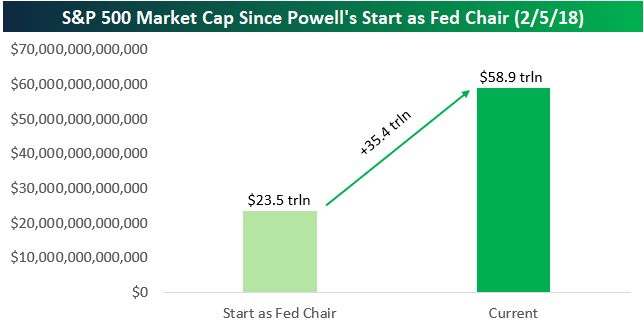
When Powell became Fed Chair in February 2018, the combined market cap of stocks in the S&P 500 was $23.5 trillion. That number has ballooned by $35.4 trillion up to $58.9 trillion today.
The S&P 500 has gained more than 180% since 2/5/18 when Powell became Chair, representing an annualized total return of 13.7%. The tech-heavy Nasdaq 100 has gained much more at 300.9% (18.7% ann.), while the Dow 30 is up 123%.
Compared to the rest of the world, Powell has kept US markets in a dominant position. The S&P has beaten the rest of the world by more than 100 percentage points since his time as Chair began.
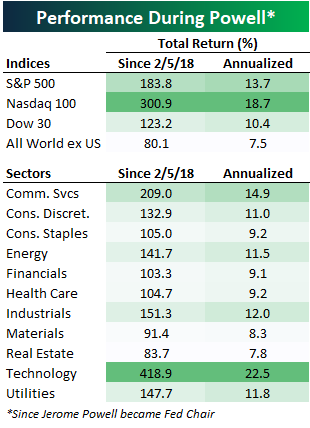
Looking at sector performance, Technology has more than doubled the next-best sector (Communication Services) during Powell’s tenure. As shown above, Tech has returned 418% since Powell took over, while Materials and Real Estate are the only two sectors that haven’t at least doubled.
Of the current S&P 500 members that were trading back in early 2018 when Powell became Chair, 59% have gained at least 100% since then. There are nearly just as many S&P 500 stocks up 500%+ (39) since Powell’s tenure began as there are stocks that are down (45).
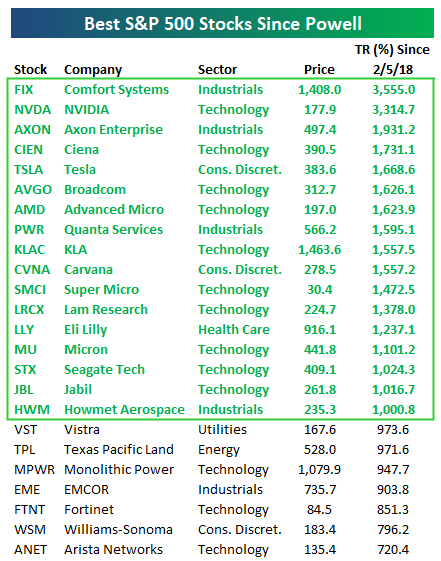
Below is a table showing the best-performing S&P 500 stocks since Powell became Chair, with the seventeen “10-baggers” highlighted in green.
You may have thought NVIDIA (NVDA) would be at the top of this list given its place as the largest company in the world right now, but a company that’s just over a tenth of NVDA’s size actually has it beat. Comfort Systems (FIX) — which builds out the mechanical, electrical, and plumbing systems for AI data centers and other infrastructure projects — is actually #1 when it comes to share-price performance under Powell. As shown, FIX is up 3,555% compared to a gain of 3,314% for NVDA.
Most of the names on the list of big winners since Powell became Chair are directly related to the AI Boom, but some that are not include Axon Enterprises (AXON) — which sells Tasers and police bodycam hardware and software, Carvana (CVNA) — which sells used cars, and Eli Lilly (LLY) — which sells weight-loss drugs and other pharmaceuticals.
Sign up for Bespoke’s Think BIG mailing list to receive an interesting market stat like this in your inbox a few times per week. Click here or on the image below to sign up. An email is all we need!

While there are seventeen “10-baggers” since Powell became Chair, not all of those stocks are in uptrends right now. Below are price charts for the six best performers in our table above. While Ciena (CIEN) and Comfort Systems (FIX) remain in strong uptrends, the other four have either traded sideways or lower over the last six months.
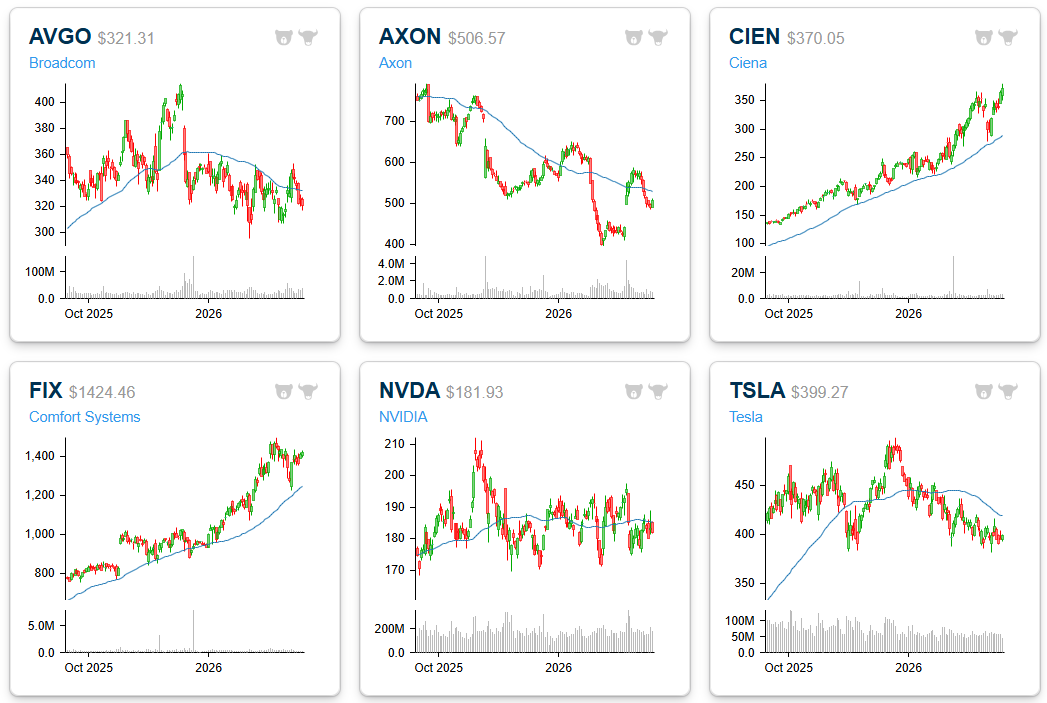
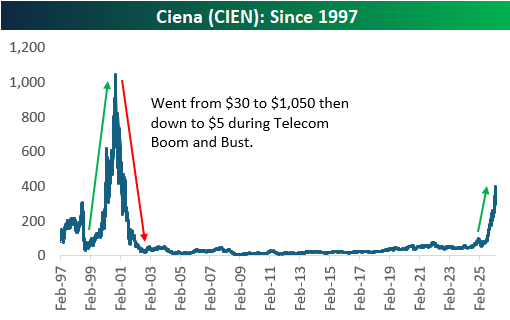
Of the six biggest winners under Powell, Ciena (CIEN) is the only one trading at record highs today. Its price action lately has been a sight to behold.
Last year at the tariff-tantrum lows, the stock was trading in the low-$50s. It’s currently trading above $400.
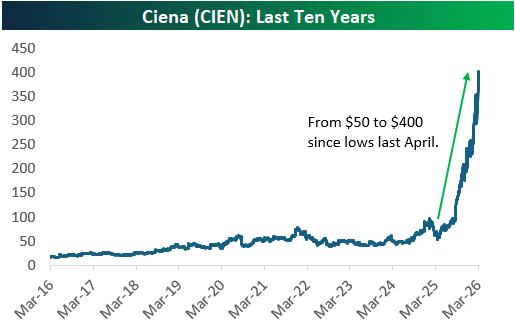
Ciena (CIEN) somewhat slid under the radar in the early years of the AI Boom, but over the last year or so, investors haven’t been able to get enough of it.
That’s because Ciena makes some of the most important networking gear for AI data centers (shown below). Every time a company makes a bigger, smarter LLM for consumption, they need more of Ciena’s gear to make that data work and move faster.

What’s even crazier about Ciena (CIEN) is that even though the stock is up nearly 1,000% in the last few years and 1,700% since Powell became Fed Chair, it still hasn’t gotten back to half of what it peaked at during the Dot Com Bubble of the late 1990s.
Just as Ciena is a key player in the AI infrastructure build-out right now, it was also a key player in the Internet/Telecom buildout of the late 1990s. After rallying from $30 to north of $1,000/share at its peak, shares plummeted to as low as $5 after the bubble burst in the early 2000s.
This should be a key reminder of how carried away investors can get during market manias, but it also shows that while the AI Boom indeed has a lot of hype, things were even crazier back in the late 90s.
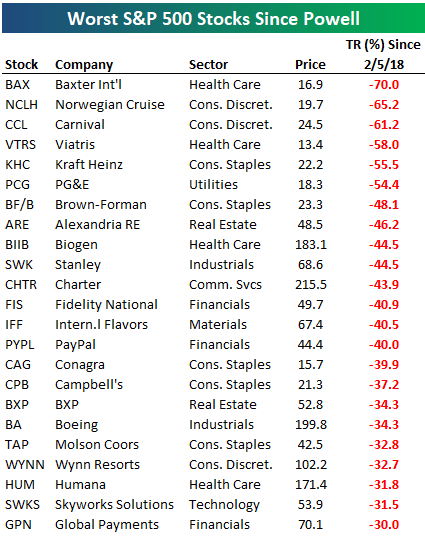
So far we’ve only discussed winners since Powell became Fed Chair, but below is a list of the S&P 500 stocks that have done the worst over his tenure. The names shown are the 23 stocks down at least 30% since 2/5/18, led by Baxter International (BAX) with a 70% drop.
Two cruise-lines rank 2nd and 3rd worst (Norwegian and Carnival) with declines of more than 60%, and another three stocks have been more than cut in half: Viatris (VTRS), Kraft Heinz (KHC), and PG&E (PCG). Other well-known names on this list of losers include Biogen (BIIB), PayPal (PYPL), Campbell’s (CPB), Boeing (BA), Molson Coors (TAP), and Wynn Resorts (WYNN).
Like this analysis? Become a Bespoke Premium member today using our March Madness special! Click below for details on how to sign up:
Chart of the Day: Bears Roar
Bears Cross 50%
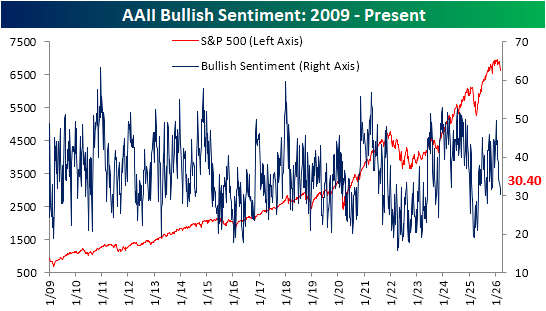
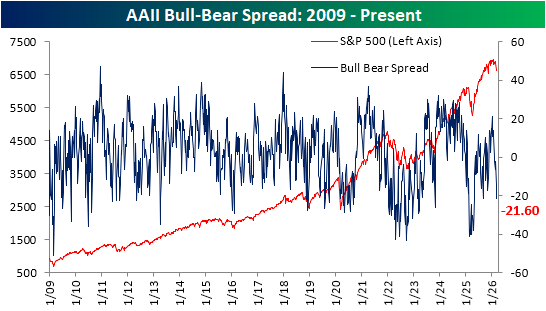
As if news headlines and price action haven’t been signals enough, investor sentiment readings are also pointing toward negative outlooks in the wake of the conflict in the Middle East. The American Association of Individual Investors (AAII) weekly sentiment survey saw only 30.4% of respondents report bullish sentiment this week. That is the lowest level since the week of 9/11/25, when it registered 28%. Additionally, as we first highlighted in today’s Morning Lineup, the 1.5 percentage point drop this week marked the seventh consecutive weekly decline in bullish sentiment, which ties another 7-week-long streak from May 1993.
Given the drop in bulls, bearish sentiment has continued to surge. This week, the reading rose another 5.6 percentage points to 52%. That is the highest reading since last May, when it was at 59.3%. Throughout the survey’s history since 1987, less than 5% of weekly readings have seen more than half of respondents report as bearish.
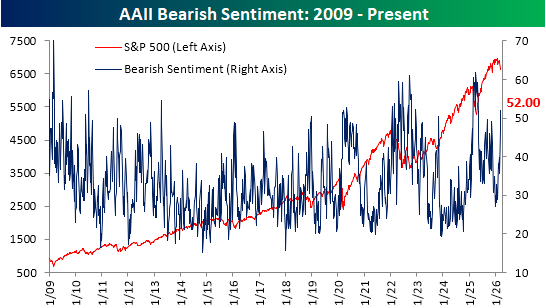
With inverse moves in bulls and bears, the bull-bear spread fell to -21.6. That narrowly surpasses the previous local low of -21.5 from the week of 9/11/25, registering the worst reading since last May.
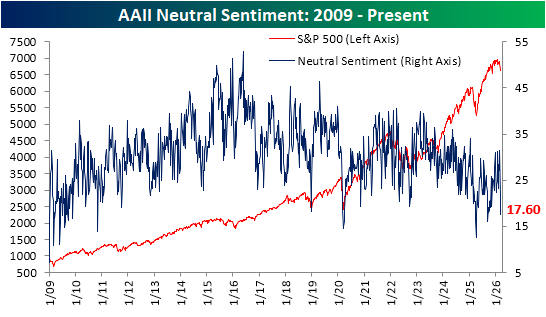
We would also note that not only has there been a big move toward bearish sentiment due to lost bullishness, but a big drop in those reporting neutral sentiment has also been a factor. Only two weeks ago, 31.4% of respondents reported neutral sentiment for the highest reading since January 2025. In the two weeks since then, it has fallen to 17.%, which ranks in the 4th percentile of all periods on record, and is the lowest since a reading of 16% last September.
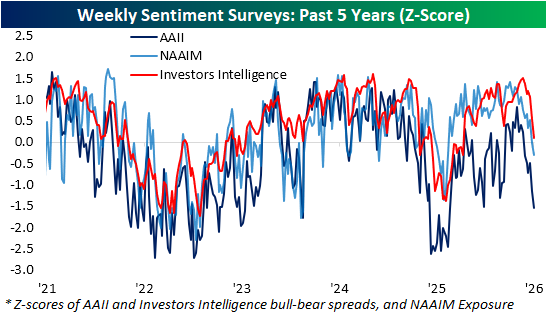
In other words, sentiment has turned overwhelmingly bearish. That is also reflected in other surveys like the Investors’ Intelligence and NAAIM Exposure index readings. The latter now indicates the lowest level of long exposure to equities since last spring, and that reading is now also below the historical average. The Investors’ Intelligence survey is still marginally bullish relative to historical norms, although it too is quickly approaching bearish readings.
Like this analysis? Join our premium members by starting a trial today! Click below for details on how to sign up:
