Bespoke’s Morning Lineup – 4/20/20 – Slip Sliding Away
See what’s driving market performance around the world in today’s Morning Lineup. Bespoke’s Morning Lineup is the best way to start your trading day. Read it now by starting a two-week free trial to Bespoke Premium. CLICK HERE to learn more and start your free trial.
Oil prices are getting absolutely slammed this morning as the front-month contract expires and nobody wants to take delivery. Even the out month contracts, however, are down by percentages that would look extreme if it weren’t for the crash in the May contract. Not surprisingly, equity futures are also down substantially as markets look to digest the gains of the last two weeks.
Read today’s Bespoke Morning Lineup for a discussion of the drivers of this morning’s crash in crude oil prices, major earnings releases, and the latest trends in the COVD-19 outbreak.

We often refer to oil as the lifeblood of the physical economy and semiconductors as the digital economy’s equivalent. Given the moves in crude oil today amid the virtual lockdown of the physical global economy, we present the chart below which shows the relative strength of the Philadelphia Semiconductor Index (SOX) versus crude oil. For this analysis, instead of using the front-month crude oil contract, though, which is down by a much larger percentage than the rest of the curve due to its expiration today, we used the second-month contract which isn’t down as much today.
Even using the second-month contract, though, the relative strength of the SOX versus crude oil is unlike anything ever seen. Since the start of March alone, the relative strength has doubled! Relative to the economy outside our windows, which is essentially on blocks right now, the economy on our screens is humming along.

Bespoke Brunch Reads: 4/19/20
Welcome to Bespoke Brunch Reads — a linkfest of the favorite things we read over the past week. The links are mostly market related, but there are some other interesting subjects covered as well. We hope you enjoy the food for thought as a supplement to the research we provide you during the week.
While you’re here, join Bespoke Premium for 3 months for just $95 with our 2020 Annual Outlook special offer.
Killing Time In Quarantine
Backyard birding is having a moment thanks to the coronavirus, with homebound Chicagoans spotting everything from great horned owls to fiery cardinals and canary-yellow finches by Nara Schoenberg (MSN/Chicago Tribune)
Birding – and providing the infrastructure for winged friends to frolic in easy site of bored humans – is having a serious moment. [Link]
Issue 15: Sourdough, Status, and Self-Isolation by Andrew Potter (Policy for Pandemics)
With lots of time on their hands, people are turning into amateur bakers. But why? It’s one way that status-seeking members of the leisure class can signal they have the time to kill while they stay at home. [Link]
Binge Nation: Average American Streams 8 Hours Of Content Per Day During Coronavirus Outbreak! by John Anderer (Study Finds)
A national survey suggests that Americans are spending an epic amount of time in front of the TV as a result of the COVID outbreak and its quarantines. [Link]
COVID Changes Everything
California COVID-19 Traffic Report Finds Silver Lining by Kat Kerlin (UC Davis)
With far fewer cars on the road, $1bn in costs have been avoided in California over the course of the various policies instituted to prevent the spread of COVID in the state. [Link]
Coronavirus Fight Hinders Action Against Other Deadly Diseases by Saeed Shah and Joe Parkinson (WSJ)
In order to prevent the spread of COVID-19 in developing countries, vaccination drives have been halted across the world; the result may reduce the spread short-term, but risks surrendering progress made in the fight against other communicable diseases. [Link; paywall]
How Many Kids Attend School Each Day? During Coronavirus, No One Knows by Tawnell D. Hobbs (WSJ)
Just taking attendance – let alone enforcing it – is proving challenging for schools that are trying to stay closed in order to prevent the impact of the virus. [Link; paywall]
Inside the life of a homeless Chicago student in the age of the coronavirus: Fear of failing — or not surviving by Nader Issa (Chicago Sun-Times)
Schools are critical for providing social services to vulnerable children, and their closure creates risks for those kids that don’t exist for anyone else. [Link]
China
China Post-Coronavirus: Signs of Life, Censorship and Paranoia by Paul Mozur (NYT)
A closely-documented story of reporters trying to get the story about life on the street in a mid-tier Chinese city, only to be stymied by aggressive efforts at controlling the narrative. [Link; soft paywall]
Stephon Marbury’s Wild Ride on the Front End of the Coronavirus Pandemic by Stu Woo and Jonathan Cheng (WSJ)
Former Knicks star and current Chines Basketball Association coach was instrumental in warning the NBA about the risks of business-as-usual, itself a key signal in the broader move to shut down activity around the US. [Link; paywall]
Investing
Renaissance’s $10 Billion Medallion Fund Gains 24% Year to Date in Tumultuous Market by Gregory Zuckerman (WSJ)
Renaissance Technologies (which almost exclusively manages internal capital) is up 39% before the hefty taxes and fees applied to the funds it manages so far this year. [Link; paywall]
Oh brother! Coronavirus calls split family fortunes on Wall Street by Lawrence Delevingne (Reuters)
The Sandler brothers have opposing views about the outlook, and both manage multi-billion dollar hedge funds that they’re using to bet on their respective conclusions. [Link]
The C-Suite
Charlie Munger: ‘The Phone Is Not Ringing Off the Hook’ by Jason Zweig (WSJ)
96 years and counting haven’t prevented Charlie Munger from looking for deals, but currently there isn’t much interest for capital from Berkshire Hathaway. [Link; paywall]
Bob Iger Thought He Was Leaving on Top. Now, He’s Fighting for Disney’s Life. by Ben Smith (NYT)
The Disney CEO was set to retire at the end of last year but the catastrophic impact of COVID-19 has forced re-evaluation as Iger reasserts himself to manage the company through its storm. [Link; soft paywall]
Social Media
Connected, but at what cost? by Brad Wible (Science)
Facebook users were given $102 to leave their social media presence behind and the result was more time socializing face-to-face, less political polarization, and improved senses of well-being. [Link]
Amazon
Coronavirus is making touch-free shopping a necessity by Ben Fox Rubin (CNet)
In addition to its delivery network, Amazon is building out other alternatives for a post-COVID world; other companies are in a similar boat as contact-free, tap-to-pay, and curbside become buzzwords. [Link]
Amazon slashes commission rates for program that gives publishers a cut of sales by Annie Palmer (CNBC)
The e-commerce company is reducing payments made to third-party sites that direct traffic to its pages, a way of reducing overhead and increasing profitability. [Link]
Economic Impacts
Glutted Oil Markets’ Next Worry: Subzero Prices by Sarah Toy (WSJ)
With demand collapsing, global oil markets are nearing a surplus so large that storage is completely unavailable and producers or marketers made end up needing to pay someone else to take their crude. [Link; paywall]
How Does Household Spending Respond To An Epidemic? Consumption During The 2020 COVID-19 Pandemic by Scott R. Baker, R.A. Farrokhnia, Steffen Meyer, Michaela Pagel, and Constantine Yannelis (NBER Working Papers)
Transaction-level data is used to identify high frequency spending changes, which are generally intuitive, but have some interesting details. [Link; 35 page PDF]
On The Front Lines
P&G Toilet Paper Factory Keeps Delivering as Coronavirus Strikes Its Town by Sharon Terlep (WSJ)
As a COVID-19 outbreak raged across southern Georgia, especially tiny Albany. Ironically, COVID was fueling demand for the output of the town’s major employer: P&G and its various toilet paper brands. [Link; paywall]
27-year-old grocery store clerk kept working because she wanted to help people. Then she died from coronavirus. by Caitlin O’Kane (CBS)
Under-protected retail workers like Leilani Jordan have borne an unbearable toll from the virus, and that toll is all the more tragic when quotes like hers are appended to their lives: “I’m going to go to work. I’m going to still go to work. I want to help.”. [Link]
MLB team employees will be the subjects of US’s largest COVID-19 antibody study by Molly Knight (The Athletic)
With the help of ten thousand employees across 27 clubs, Major League Baseball is helping roll out a widespread study of how many Americans may have had COVID-19 already. [Link; paywall]
Potpourri
The Stockdale Paradox (Jim Coillins)
How to persevere and survive amidst a brutal period? Don’t cave in to either pessimism or optimism, and instead hold on to belief in success despite inevitable massive costs. [Link]
The True Story of The Lost Boys’ Sax Man (Gizmodo)
An oral history of an iconic one-time role for an obscure musician who has been known for nothing else since. [Link]
A Team Exploited the Coronavirus Pandemic to Set a 26-Hour 38-Minute Cross-Country Record by Angelo Melluso (Road & Track)
The Cannonball Run, a not-strictly-legal time trial from New York to Los Angeles, was tested by an under-the-radar team hoping to take advantage of driverless roads amidst the pandemic. [Link]
Read Bespoke’s most actionable market research by joining Bespoke Premium today! Get started here.
Have a great weekend!
The Bespoke Report — Hiding Out in Tech
This week’s Bespoke Report newsletter is now available for members.
The S&P 500 is down 11% year-to-date, but would you believe that the Tech-heavy Nasdaq 100 (QQQ) is actually now up more than 1% in 2020? What virus?
This week’s Bespoke Report covers all this week’s market events and discusses how they may impact performance going forward. To read the report and access everything else Bespoke’s research platform has to offer, start a two-week free trial to one of our three membership levels. You won’t be disappointed!

The Closer: End of Week Charts — 4/17/20
Looking for deeper insight on global markets and economics? In tonight’s Closer sent to Bespoke clients, we recap weekly price action in major asset classes, update economic surprise index data for major economies, chart the weekly Commitment of Traders report from the CFTC, and provide our normal nightly update on ETF performance, volume and price movers, and the Bespoke Market Timing Model. We also take a look at the trend in various developed market FX markets.

The Closer is one of our most popular reports, and you can sign up for a free trial below to see it!
See tonight’s Closer by starting a two-week free trial to Bespoke Institutional now!
Daily Sector Snapshot — 4/17/20
How Markets Performed During the Spanish Flu
With equities surging into the close ahead of the weekend, traders are shrugging their shoulders wondering how the hell the market is rallying given the economic damage inflicted by the COVID-19 outbreak, which has been cited as the worst pandemic to hit the United States since the 1918 Spanish flu. This leads to the question, how did the stock market perform during the Spanish flu outbreak? The chart below compares the performance of the DJIA to the weekly mortality rate of the Spanish flu during each of the waves of that pandemic from mid-1918 through early 1919 (as cited in a WSJ article earlier today).
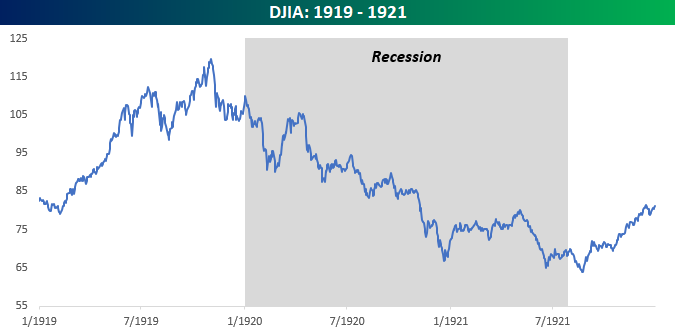
Looking at how the outbreak of the Spanish flu played out, there were basically three different waves of the virus (red line). The first wave in the summer of 1918 was a relatively mild one compared to the other two, and the DJIA’s performance during that wave was essentially flat as it never declined more than 3%. The real damage from the Spanish flu was in the fall of 1918 when the mortality rate spiked up as high as 24 per 1,000 people per week. During that wave of the pandemic, which also came in the thick of a post-WWI recession, the DJIA peaked just as the wave was getting underway and fell for the next three months. Even with the severity of the outbreak during that wave, though, the DJIA never fell more than 11% from peak to trough. On a comparative basis, even after the 28% rally over the last four weeks, the S&P 500 is still down 15% from its high. Obviously, comparing two periods more than 100 years apart is hardly an apples to apples comparison, but it’s still interesting that during what was an even deadlier pandemic in 1918, the DJIA never even approached anything close to a bear market.
Looking at the chart, the DJIA’s low of the decline coincided with the second wave of the outbreak just as the third (more mild) wave of the pandemic was getting underway. Furthermore, during that third wave, the DJIA kicked off what was a strong rally of more than 25% in less than three months on optimism over an end to the outbreak.

So, once the mortality rate of the Spanish flu dropped down to zero, it must have been nothing but clear skies ahead for the Dow, right? Well, not necessarily. When it comes to the stock market, there’s always something. Less than a year after the mortality rate from the Spanish flu dropped down to zero, the US economy actually went into a year and a half long recession. That contraction was so severe that it has been dubbed the Depression of 1920/21, one where unemployment topped 10% and deflation was as high as 18%! The bear market that accompanied that recession was also severe as the DJIA declined 46%. Imagine coming out of a pandemic with nothing more than an 11% correction and then getting socked with that! Start a two-week free trial to Bespoke Institutional to access our full range of research and interactive tools.
Bespoke’s Morning Lineup – 4/17/20 – It’s All About Size
See what’s driving market performance around the world in today’s Morning Lineup. Bespoke’s Morning Lineup is the best way to start your trading day. Read it now by starting a two-week free trial to Bespoke Premium. CLICK HERE to learn more and start your free trial.
There was a trifecta of good news after the close last night that sent futures surging and putting the S&P 500 on pace for a gain of over 2% at the open. First, it was reported that Gilead’s (GILD) COVID-19 treatment was showing signs of success. Then, Boeing (BA) announced plans that it would resume production at its Puget Sound plant. Finally, a White House Press Conference outlined plans and criteria for bringing the economy back online. While there has never been any doubt that the US economy would come back online at some point, these three events, taken together, raised optimism (although doesn’t guarantee) that the comeback will be sooner rather than later.
Read today’s Bespoke Morning Lineup for a discussion of the drivers of this morning’s rally in futures, some miserable data out of China, major earnings releases, and the latest trends in the COVD-19 outbreak.
In looking at major US indices and where they stand relative to their trading ranges, the one major takeaway is that it’s all about size. The only major US index that is above its 50-day moving average (DMA) is the large-cap Nasdaq 100 (QQQ). Right behind QQQ, the S&P 100 (OEF), which is made up of the 100 largest stocks in the S&P 500, is right on the verge of breaking back above its 50-DMA. Behind SPY, other large-cap ETFs are also the closest to their 50-DMA.
As you move down the table, though, it’s all about market cap. Below all the large-cap ETFs, you’ll find three mid-cap ETFs and then three more small-cap ETFs at the bottom of the list. It’s also not just with respect to trading ranges either. For both YTD and 5-day returns, it’s almost as though the tables are sorted by those columns as well. The message the market seems to be sending is that the road to recovery is going to be much easier for large-cap US corporations than their small-cap peers.

Bespoke’s Sector Snapshot — 4/16/20
The Closer – Energy Expectant, Data Thursday – 4/16/20
Log-in here if you’re a member with access to the Closer.
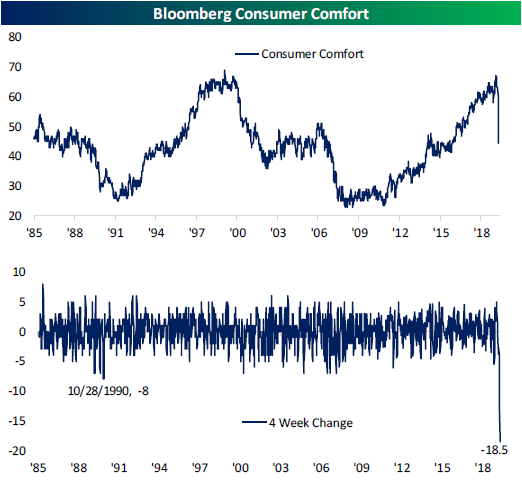
Looking for deeper insight on markets? In tonight’s Closer sent to Bespoke Institutional clients, we evaluate Energy stocks’ performance given the collapse in crude oil prices. Next, we delve into Bloomberg’s weekly consumer comfort data before shifting over to an updated look at our Five Fed Manufacturing composite. We finish with a look at today’s housing starts and permits numbers.
See today’s post-market Closer and everything else Bespoke publishes by starting a 14-day free trial to Bespoke Institutional today!
B.I.G. Tips – Death by Amazon – 4/16/20
Our “Death By Amazon” index was created many years ago to provide investors with a list of retailers we view as vulnerable to competition from e-commerce. In 2016, we also created our “Amazon Survivors” index which is made up of companies that look more capable of dealing with the threat from online shopping. To see how the two indices have been performing lately and view the full list of stocks that make up the indices, please read our newest report on the subject available to Bespoke Premium and Bespoke Institutional members.
To unlock our “Death By Amazon” and “Amazon Survivors” indices, login or start a two-week free trial to either Bespoke Premium or Bespoke Institutional.