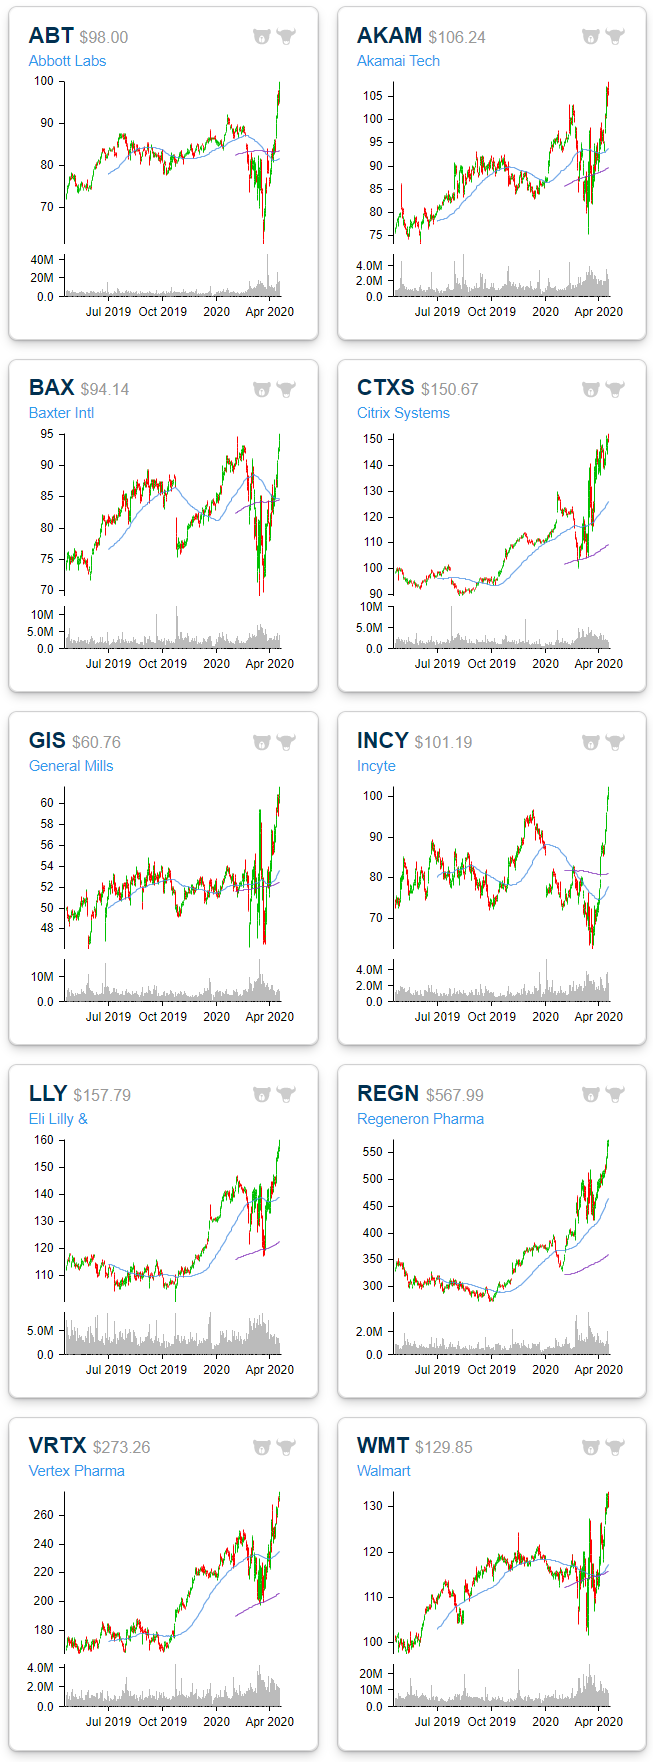
Health Care Leading in New Highs
Breadth was pretty lackluster yesterday with only about 15% of the S&P 500 finishing the day higher. Despite this, of the stocks that did rise, there were a handful that reached new 52-week highs. As shown below in charts from our Daily Sector Snapshot, with yesterday being no exception, recently the stocks reaching 52-week highs have been predominately concentrated in the Health Care sector which saw a net of 10% of its stocks at new highs yesterday. Meanwhile, Technology and Consumer Staples were the only other sectors that saw an uptick in net 52-week highs yesterday. While there were no other highs across each of the other sectors, there was not an increase in 52-week lows either. In other words, for the most part, S&P 500 stocks are now trading somewhere within the past year’s range rather than breaking out or down.

The charts below are from the 52-week highs screen at our Chart Scanner tool. These are the 10 S&P 500 stocks that broke out to new 52-week highs yesterday. Most of these have been in uptrends for the past year while the recent spike in volatility has ended patterns of sideways trends for others like Abbot Labs (ABT) and General Mills (GS). As previously mentioned, the bulk of these stocks are Health Care names including Abbott Labs (ABT), Baxter (BAX), Incyte (INCY), Eli Lilly (LLY), Regeneron (REGN) and Vertex (VRTX). Additionally, Consumer Staples stocks benefiting from the COVID economy like major grocery chain Walmart (WMT) and food manufacturer General Mills (GIS) also make the list. Start a two-week free trial to Bespoke Institutional to access our Chart Scanner, custom screens, and much more.
Not Your Typical Tuesday. Or Is It?
While every other day of the week has seen multiple gaps down of more than 1.5% since the peak in February, today is the first time in that span that there will be a gap down of more than 1.5% on a Tuesday. Given the lack of big gaps down, Tuesdays have also seen the strongest average return of any weekday so far in 2020. While every other day of the week has averaged declines, Tuesday has seen an average gain of 1.16%. That’s quite a disparity!

While average returns for Tuesday relative to other weekdays have been stellar, it doesn’t tell the whole story. The table below shows the S&P 500’s daily returns so far in 2020. Looking at the individual occurrences, Tuesdays have actually been up days less than half of the time. If it wasn’t for three strong Tuesdays in the month of March, returns for the second trading day of the week wouldn’t be nearly as positive.
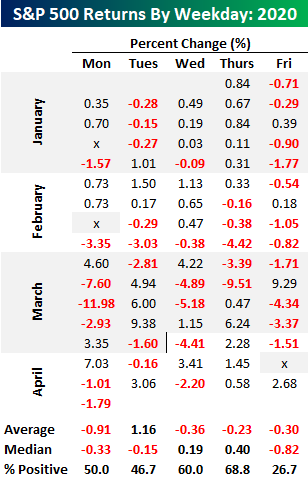
Looking at median returns instead of averages shows how Tuesdays haven’t been nearly as strong as they seem. Looked at this way, Tuesday’s median decline of 0.15% ranks right in the middle of the pack behind gains for Thursday and Wednesday but well ahead of the 0.33% decline for Mondays and the 0.82% decline on “Corona Fridays”. Outside of a couple of outliers, Fridays have not been a good day for equities this year. Start a two-week free trial to Bespoke Institutional to access our full range of research and interactive tools.

Chart of the Day: S&P 500 (SPY) Gaps Down of 1.5%+
Bespoke’s Morning Lineup – 4/21/20 – No Turnaround in Equities
See what’s driving market performance around the world in today’s Morning Lineup. Bespoke’s Morning Lineup is the best way to start your trading day. Read it now by starting a two-week free trial to Bespoke Premium. CLICK HERE to learn more and start your free trial.
If you were banking on another turnaround Tuesday following Monday’s declines, it’s not looking that way as of now. A lot can change between now and the close, or for that matter, the open, so we’ll see how it plays out. In earnings news, there hasn’t been much to speak of, which was expected, and investors are generally taking a risk-off approach, sending the VIX back up towards the high 40s.
Read today’s Bespoke Morning Lineup for a discussion of the latest moves in the crude oil market, major earnings releases, the latest trends in the COVD-19 outbreak, and other stock-specific news of note.

The yield on the 10-year US Treasury is down 5 basis points (bps) this morning to a yield of just 0.55%. While that is nowhere near the recent low of 31 bps from early March, on a closing basis, it’s close to new lows. As shown in the chart below, the only day that the yield was lower on a closing basis was on 3/9 when it finished the day at 54 bps- a level that’s certainly within striking distance. In a world where treasury yields are near record lows and crude oil is up over 90% on the day (sort of) and still at negative levels, it’s understandable that the equity market would be under pressure.

The Closer – WTI: Two Truths & A Lie – 4/20/20
Log-in here if you’re a member with access to the Closer.
Looking for deeper insight on markets? In tonight’s Closer sent to Bespoke Institutional clients, we delve deep into the historic drop into negative crude oil prices today. We look at where else saw negative prices and who is to benefit from the chaos. Next we show just how few companies are providing guidance and how the few largest companies are impacting the market.

See today’s post-market Closer and everything else Bespoke publishes by starting a 14-day free trial to Bespoke Institutional today!
Daily Sector Snapshot — 4/20/20
S&P 1500 Sector Weightings — Energy Now the Smallest
With oil prices continuing to plunge, the Energy sector is now officially the smallest of the eleven major sectors in the S&P 1500, which is made up of large-caps, mid-caps, and small-caps. Energy makes up just 2.63% of the S&P 1500, which is 2 basis points lower than the next smallest sector — Materials — at 2.65%. Real Estate and Utilities are the next smallest sectors with weightings of 3.41% and 3.49%, respectively.
At the top of the food chain is Technology with a weighting of 24.78%, or about 10x the size of Energy. Health Care ranks second at 15.71%. Combined, Technology and Health Care make up more than 40% of the S&P 1500 in this new post-Covid world. The seven smallest sectors have a combined weighting that is still less than the weighting of Tech and Health Care.

Even more remarkable is how big some of the largest individual companies are compared to entire sectors of the economy. Below we show the market cap of the entire S&P 1500 Energy, Materials, Real Estate, and Utilities sectors versus the market caps of the four largest stocks in the S&P 1500 — Microsoft (MSFT), Apple (AAPL), Amazon (AMZN), and Alphabet (GOOGL). Microsoft is now nearly two times as large as the entire Energy and Materials sectors, or put another way, the entire Energy and Materials sectors combined are just barely larger than Microsoft (MSFT). Apple and Amazon as well are both larger than the four smallest sectors of the market. And for Alphabet (GOOGL), its market cap puts it right in between the size of the entire Materials and Real Estate sectors. Combined, the four largest stocks make up about 17% of the S&P 1500, while the four smallest sectors in the index make up just 12.2% of the index. There are 339 individual stocks across the four smallest sectors in the S&P 1500. Start a two-week free trial to Bespoke Institutional to access our full range of research and interactive tools.

Chart of the Day: 50% Retracements. Now What?
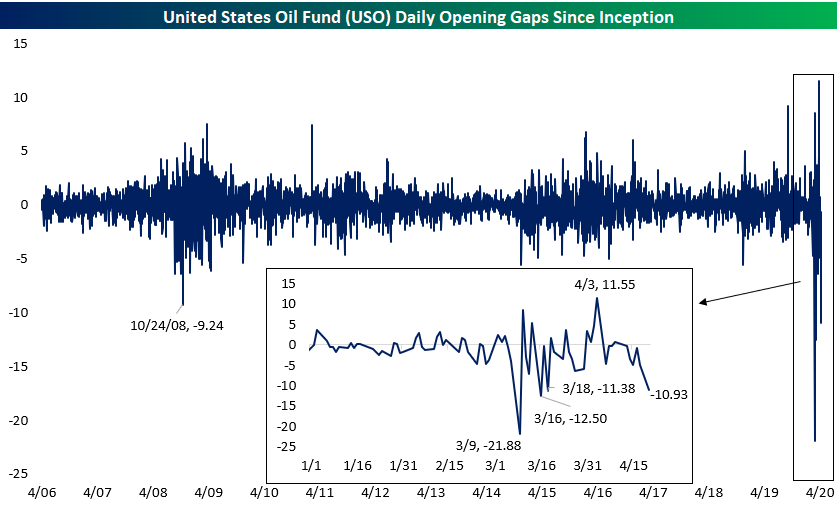
Fourth Largest Gap Down Ever for Crude Oil ETF (USO)
Crude oil is the story of the day today. The cause for recent declines in crude have been a result of surging supplies on flat-lining demand while people around the globe follow stay at home orders. Front month futures (May 2020) facing expiration tomorrow are down over 40% while contracts further out on the curve are also down substantially though by not nearly as much. That brings front month crude oil to around the same levels as early 1999/late 1998 and the summer of 1986.
The United States Oil Fund (USO) has about 80% of its portfolio in what will be the new current front month futures (June 2020) after rolling a couple of weeks ago with the rest of the portfolio in the second month contracts (July 2020). Despite record inflows, the fund will face headwinds going forward as a result of the costs of rolling with crude oil in the steepest contango on record as we discussed in our Morning Lineup. That also comes as today’s declines brought USO to its lowest levels on record, breaching support from late March.

Going back to the USO’s inception in 2006, its gap down of 10.93% at today’s open was the fourth largest opening gap down on record. As for the three larger gaps, those have all come since the beginning of March as shown in the chart and inlaid chart below. Prior to the current ongoing saga of dramatic price swings, there was never a double-digit gap down with the next largest being a 9.24% decline on October 24th of 2008. Over the past three times that USO gapped down 10% or more since March, the ETF averaged a 4% decline from open to close. Start a two-week free trial to Bespoke Institutional to access our Morning Lineup and much more.
Gas Prices vs Crude Oil
With oil in the midst of what could be its sharpest downturn in history, it’s not a surprise to see that gas prices at the pump have also been declining. Looking at the chart below, the national average price of gasoline has had a close correlation to the price of crude oil, but looking a little closer, prices at the pump haven’t dropped nearly as much as the price of crude oil. For example, while crude oil prices are at their lowest levels since the 1990s, the national average price of a gallon of gas is still above where it was at the lows in 2016.
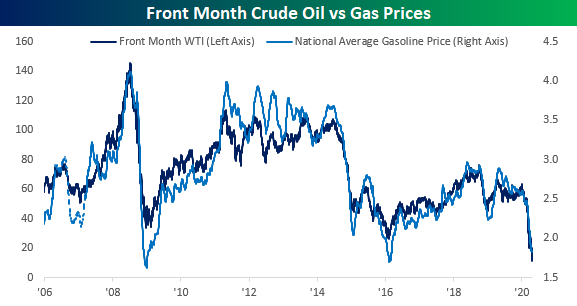
Another way to illustrate this is by comparing the performance of crude oil vs average prices at the pump over the last 50-trading days. During that span, front-month WTI prices are down 78% while average prices at the pump are down less than a third of that at 25.6%. With a spread of over 50 percentage points, the performance gap between the two has never been wider.

While gas prices are understandably lower so far this year, these declines have come at a time when prices have consistently risen. Going back to 2005, this is the first year that average gasoline prices have been below $2 per gallon at this time of year. Not only that but it also the first time that prices have been down on a YTD basis through 4/20 as well. Normally, prices at the pump are up over 15% YTD at this time of year, but due to the global pandemic, prices this year are down almost 30%. Now, if only consumers had anywhere to go and take advantage of these abnormally low prices! Start a two-week free trial to Bespoke Institutional to access our full range of research and interactive tools.
