Internationals Benefit From Dollar’s Drop
During the market turmoil in February and March, the US dollar dropped 4.81% from its high on February 20th to its low on March 9th. That was followed up with a massive run up of 8.26% over the next ten days as the dollar index rose to its highest levels since the final days of 2016/first days of 2017. Since peaking on March 19th, however, the dollar has faced constant selling as it now sits at the lower end of the past couple of year’s range. A weaker dollar, all else equal, would make the price point of US products more attractive to foreign buyers and as a result, should theoretically bode well for companies that base a larger share of their revenues from outside the US.
In the chart below, we show the average performance of Russell 1000 stocks since the dollar’s high on March 19th based on deciles of international revenue exposure using data from our International Revenue Database. The 1st decile represents the stocks that have the highest share of total revenues derived from abroad while the 10th decile includes all stocks who’s revenues entirely come from within US borders. As shown, those with the most international exposure—which includes many semiconductors and some travel-related and Consumer Staples names— have generally outperformed most other deciles in that time. Granted, this was not the strongest decile. The 8th and 9th deciles were the strongest performers since March. These deciles are generally stocks with less than a fifth of revenues coming from abroad, and they actually saw even stronger returns on average since March 19th. Meanwhile, those with no international exposure are only up 34.5% on average since March 19th. Click here to view Bespoke’s premium membership options for our best research available.

B.I.G. Tips – Death by Amazon – 7/9/20
So far this year, Amazon has added $620bn to its market cap versus $1.12 trillion in market cap declines for the rest of the current S&P 500 membership that was trading at the end of 2019. 357 companies have seen declines in market cap YTD, totaling $3.3trn. In short, equity market cap is consolidating dramatically into the top of the index. A similar process has been underway in economic data. For Q1, the Census reported e-commerce sales topped 11% of total retail sales for the first time, a 0.5% increase versus Q4 of 2019. That increase in share was the largest ever and is indicative of how much market share is being gobbled up by Amazon and a few other e-commerce giants. From an equity market return perspective, huge gains for Amazon are totally consistent with the big underperformance of our Death By Amazon Index over the past few months. Distress leading to de-listings has also mounted, as measured by four different names coming out of our Death By Amazon Index this month.
Our “Death By Amazon” index was created many years ago to provide investors with a list of retailers we view as vulnerable to competition from e-commerce. In 2016, we also created our “Amazon Survivors” index which is made up of companies that look more capable of dealing with the threat from online shopping. To see how the two indices have been performing lately and view the full list of stocks that make up the indices, please read our newest report on the subject available to Bespoke Premium and Bespoke Institutional members.
To unlock our “Death By Amazon” and “Amazon Survivors” indices, login or start a two-week free trial to either Bespoke Premium or Bespoke Institutional.

The “Miracle” Nasdaq 100
For anyone unfamiliar with the 1969 Miracle Mets, the “Amazins” were 10 games out of first place as late as mid-August and then went on to win 38 out of their last 49 games to finish in first place over the Cubs. From there, the Mets went on to win the first World Series in the history of the franchise in what at the time was one of the biggest turnarounds in the history of baseball. Ironically, in 2007, the Mets were on the other end of another historic turnaround after they blew a seven-game division lead with less than a month left in the season by losing 12 of their last 17 games. But that collapse is a story for another time.
Like the Miracle Mets in 1969, the Nasdaq 100 in 2020 has also staged a historic turnaround. After trading up over 10% earlier in the year, the gains quickly evaporated with the COVID outbreak. Within two months, the Nasdaq 100 went from a YTD gain of over 10% to a decline of over 20% by late March. From there, though, the Nasdaq has gone on an epic run, not only erasing all of its losses but also trading to record highs and a gain of over 20% on the year.

The frequency of positive days for the Nasdaq 100 provides another illustration of the index’s strength this year. So far this year, the index has traded higher on 63% of all trading days. That may not sound like much, but if the year were to end today, it would be the highest percentage of positive days for a given year in the Nasdaq 100’s history. On a side note, it’s interesting to see in this chart how similar the percentage of positive days has been on a year to year basis over time. There has never been a year where fewer than 46% of all trading days have been positive, and prior to 2020, there has never been a year where more than 62% of all trading days were higher.

Obviously, the year is only a bit more than half over, so it’s far from a guarantee that the percentage of positive days will remain as elevated as it is now. To make an apples to apples comparison, in our most recent B.I.G. Tips report we looked at prior years where the Nasdaq 100 saw a similar consistency of daily gains to see how the rest of the year played out. To read the entire report login or start a two-week free trial to either Bespoke Premium or Bespoke Institutional.
Are Claims Rising or Falling?
Jobless claims remain elevated on a seasonally adjusted basis though they did fall once again this week marking a 14th consecutive week with lower initial claims. The current streak of weekly declines now doubles what was the previous record streak of 7 weeks ending in November of 2013 and October of 1980. Claims came in at 1.3 million which was below estimates of 1.375 million but still were down 99K from last week. As we have frequently made note of recently, that is a smaller improvement than earlier in the pandemic, but this week’s decline was the largest since the first week of June’s 331K drop.

On a non-seasonally adjusted (NSA) basis, claims came in a hair below 1.4 million, down from 1.431 million last week. Compared to seasonally adjusted claims, the NSA print was less impressive at 31.6K but that too was the largest decline since June 12th. Again, the pace of improvement remains lackluster when compared to the first leg lower earlier in the spring. Whereas each week of May saw NSA claims average a decline of 379K, since the beginning of June claims have only averaged a 44K decline even with this week’s larger drop.

As for those that remain unemployed, continuing claims fell by 698K to 18.062 million. That is the lowest level of continuing claims since mid-April’s 18.011 million reading. Continuing claims have now fallen for five consecutive weeks; far from the longest streak on record, but that is the longest such streak since another five-week-long streak in April of last year.

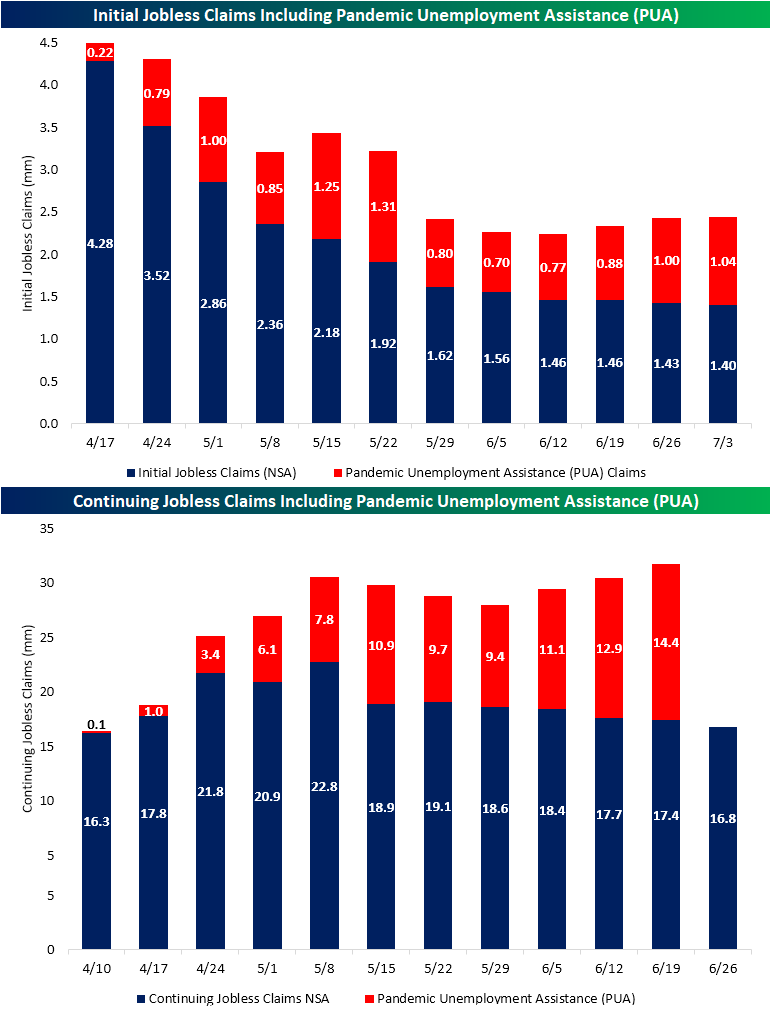
While the trends have generally been positive for the past several weeks when factoring in other claims like Pandemic Unemployment Assistance (PUA) the picture is not as rosy. In addition to the roughly 1.4 million initial jobless claims filed (on a non-seasonally adjusted basis) this week, there were another 1.04 million PUA claims filed, totaling 2.439 million claims on the week. As shown in the chart below, that is actually up from 2.428 million last week. This week’s increase was actually a third consecutive week with higher overall claims and the highest level since the second half of May.
Continuing PUA claims are lagged and an extra week from the already one week lag in continuing claims meaning the most recent data for these claims that we have is for the week ending June 19th, however, these are showing the same dynamic. Unadjusted for seasonality, for the week ending June 19th regular continuing claims totaled 17.4 million which was lower for a fourth consecutive week. On top of those, PUA claims rose to 14.4 million. Adding in PUA claims, this was the third consecutive higher reading for PUA claims. Unadjusted continuing claims including PUA claims now sits at 31.8 million which is the highest level since they were first reported in April. In other words, regularly reported jobless claims have improved recently but the addition of other types of claims like PUA, paints a weaker picture of the labor market in which claims are rising rather than falling. Click here to view Bespoke’s premium membership options for our best research available.
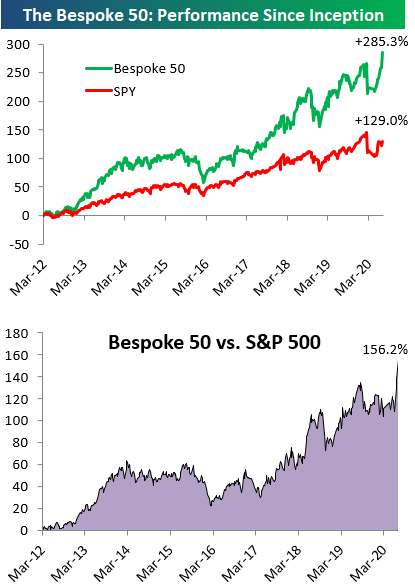
The Bespoke 50 Top Growth Stocks — 7/9/20
Every Thursday, Bespoke publishes its “Bespoke 50” list of top growth stocks in the Russell 3,000. Our “Bespoke 50” portfolio is made up of the 50 stocks that fit a proprietary growth screen that we created a number of years ago. Since inception in early 2012, the “Bespoke 50” has beaten the S&P 500 by 156.2 percentage points. Through today, the “Bespoke 50” is up 285.3% since inception versus the S&P 500’s gain of 129.0%. Always remember, though, that past performance is no guarantee of future returns. To view our “Bespoke 50” list of top growth stocks, please start a two-week free trial to either Bespoke Premium or Bespoke Institutional.
Tesla (TSLA) Now the 16th Largest US Stock
Tesla’s (TSLA) meteoric rise in recent weeks has been widely followed especially as the company’s market cap eclipsed that of all other major auto manufacturers including the previous largest company: Toyota. While it is not a member of the S&P 500, in the table below we compare TSLA to the other 29 largest stocks (by market cap) in the index.
As we noted on Monday, TSLA has been one of the best-performing stocks year to date out of a broader range of stocks (the Russell 1000), but among the largest stocks in the S&P 500, its 226.51% YTD gain is even more impressive. That is triple the performance of the next best performer of these 30 stocks — NVIDIA (NVDA) — which has risen 73.86% in 2020.
Back at the start of the year before its 200%+ increase, TSLA was valued around $75 billion, which is around the size of the current market caps of stocks like American Express (AXP) and Altria (MO). After its massive run higher, it would now be the 16th largest stock in the S&P 500 just behind names like Home Depot (HD) and UnitedHealth (UNH). When it comes to the actual price of a share, TSLA would also be close to the top of the list for the S&P 500. If it was in the S&P, Tesla would be one of six other stocks in the index with prices above $1,000 per share. Click here to view Bespoke’s premium membership options for our best research available.

China Charges Higher
We’ve highlighted the run in Chinese equities quite a lot in the last several days, but it keeps getting more and more extreme. With a gain of over 1% overnight, China’s CSI 300 not only turned in its eighth straight day of gains but also its eighth straight day of rallying more than 0.5%. In the history of the CSI 300 dating back to 2002, there has only been one other time where the CSI 300 saw eight or more straight daily gains of 0.5%. That was back in April 2007.

If you don’t remember what was going on with Chinese equities back in April 2007, take a look at the chart below. The last time the CSI 300 had a streak of 8+ days of 0.5% daily gains, the CSI had already doubled in the prior six months. From there, though, it went on to nearly double again in the next six months. Eventually the bubble burst, and it wasn’t much more than a year later that the CSI 300 was back below where it was in April 2007. Like what you see? Click here to view Bespoke’s premium membership options for our best research available.

Bespoke’s Morning Lineup 7/9/20 – Europe Still Lags and China Charges Ahead
See what’s driving market performance around the world in today’s Morning Lineup. Bespoke’s Morning Lineup is the best way to start your trading day. Read it now by starting a two-week free trial to Bespoke Premium. CLICK HERE to learn more and start your free trial.
It’s been a quiet session overnight, and futures are currently indicating a flat open in the S&P 500 and a positive open in the Nasdaq (what else is new?). The big story overnight has definitely been the rally in Chinese equities. While the CSI 300 opened down slightly at the open, it immediately rallied into positive territory and finished up over 1%. Today’s gain not only marks the 8th straight day of gains but also the 8th straight day where the index has rallied more than 0.5%. In the history of the CSI 300 (since 2002) the only other time the index saw that many consecutive gains of more than 0.5% was back in April 2007, right in the middle of that massive bubble.
Shifting focus back to the US, the key indicator to watch today is Jobless Claims at 8:30. Consensus expectations are for 1.375 million which would be down from last week’s reading of 1.427 million. That would extend the record streak of w/w declines up to 14. Despite that record run of w/w declines, in the last ten weeks, Jobless Claims have been higher than expected nine times. Talk about threading a needle!
Be sure to check out today’s Morning Lineup for a rundown of the latest stock-specific news of note, auto sales in China, global and national trends related to the COVID-19 outbreak, and much more.

As you’ve seen each day in the Morning Lineup, case counts and hospitalizations in the US have only been trending higher over the last few weeks. While conditions haven’t improved in the US, you’ve no doubt seen the trends in Europe, which have been improving. Given the diverging paths of the outbreak on each side of the Atlantic, we’ve seen parts of the US rollback re-opening while Europe continues to move forward.
Against this backdrop, you would think the European economy and equity markets would be doing better than the US, but at this point that hasn’t been the case. The chart below shows the performance (in dollar-adjusted terms) of the S&P 500 and Europe’s STOXX 600 since both indices bottomed on 3/23. In the three and a half months since the low, Europe’s STOXX 600 is up an impressive 37.8%. Over that same span, though, the S&P 500 is up over 41%! Now, when we’re talking such large numbers, a difference of less than four percentage points doesn’t seem like much, but it seems a bit surprising that US equities are even outperforming at all. Unless the market has it wrong, the message it’s sending is that looking out six to nine months, the US will find itself in a better place than Europe.
