The Closer – Risk Appetite, Revisions, Housing – 9/9/25
Log-in here if you’re a member with access to the Closer.
Looking for deeper insight into markets? In tonight’s Closer sent to Bespoke Institutional clients, we lead off with a look into IPO performance and the outstanding guidance from Oracle (ORCL) (page 1). Next, we review today’s revisions to payrolls (page 2) followed by a dive into the latest housing data that includes ICE’s Mortgage Monitor Report (page 3) and inventories data from Realtor.com (pages 4 and 5).
See today’s full post-market Closer and everything else Bespoke publishes by starting a 14-day trial to Bespoke Institutional today!
Daily Sector Snapshot — 9/9/25
Small Businesses Shy From Expansion
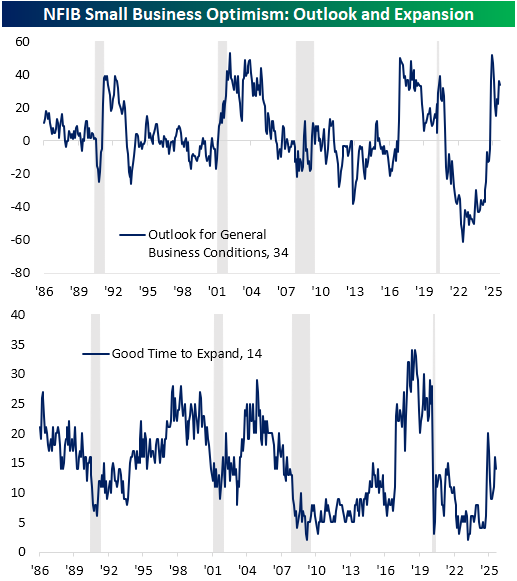
This morning’s release of the NFIB’s gauge on small business optimism saw the headline index climb to 100.8, the strongest level since January. While there was an increase in the Optimism Index, under the hood, breadth was more mixed. For example, the outlook for the economy and the share of respondents viewing now as a good time to expand were both lower month over month. With regards to the former, the two-point decline still leaves the index in the 88th percentile of readings historically, whereas the latter is now below the historical median.
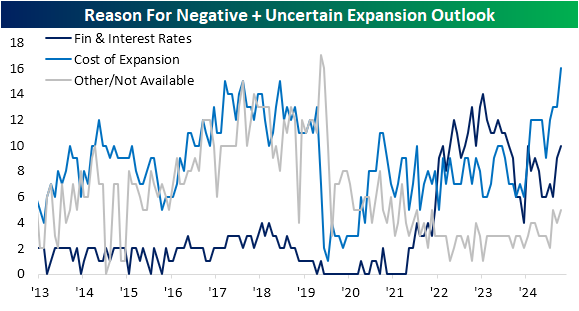
In addition to the index on expansion outlook, the report also details the reasons respondents give for various outlooks. Of those who view now as a good time to expand, only 1% pointed to sales prospects as the reason, while another 5% pointed to the political climate, and another 6% credited economic conditions. As for negative or uncertain responses, the bulk of responses (21% and 13% respectively) blamed economic conditions. While that reason accounted for the bulk of responses, costs are also appearing to be prohibitive. As shown below, for negative and uncertain expansion outlooks combined, 16% of responses blamed the cost of expansion, which is a record high for the series going back to at least 2013. While not at a new high, financials and interest rates have also risen recently, albeit with rate cuts on the horizon, so that reading could pivot lower in the near future. While any further details on what exactly the reasons may be are unfortunately unavailable, we would also note that “other” responses have likewise risen and came in at the high end of the past few years’ range.
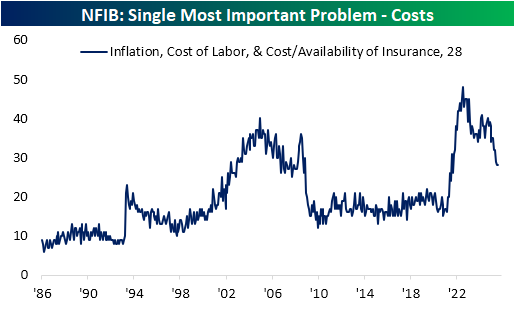
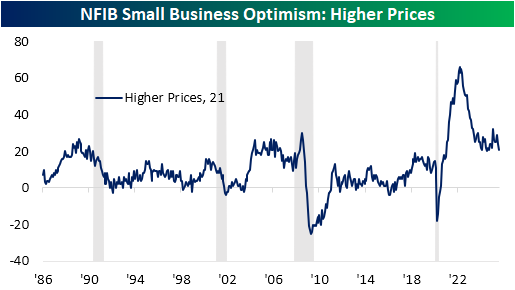
While high costs may appear to be the reason firms are not viewing now as a good time to expand, other data in the report counters this argument. For example, the combined share of respondents who view their most important problems as either inflation, cost of labor, or cost/availability of insurance has continued to fall. Likewise, the share of respondents reporting higher prices is also at the low end of the post-pandemic range.
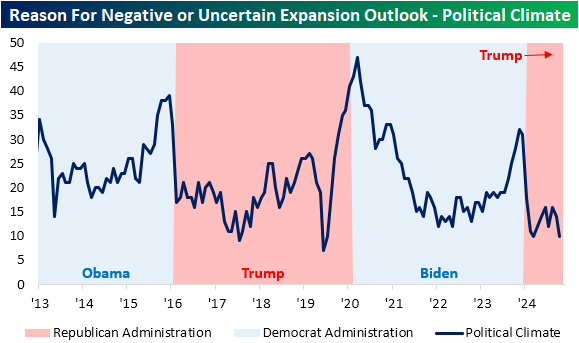
As noted previously, the NFIB survey tends to show political bias with favoritism toward Republican administrations. In other words, small business sentiment has historically tended to be better when a Republican is in office. For example, during Democratic administrations, an average of 13.9% of responses from respondents with a negative expansion outlook have blamed politics, but during Republican administrations, the average declines to 6.4%. Below we show the combined responses for negative and uncertain outlooks that have blamed politics. While Trump’s election resulted in a sharp decline earlier this year, there had been a rebound as policies like tariffs began to roll out. In the past few months, though, those politics-based negative outlooks have once again reverted lower and are nearing record lows. This dynamic of possibly temporary policy shocks to sentiment is something that we discussed related to the report’s labor data in today’s Morning Lineup.
Finally, we would note that while overall labor market indicators have shown modest improvement, or at the very least stability, one exception is the share of respondents reporting that job openings are hard to fill. As shown below, that category is now showing its weakest levels since December 2020.
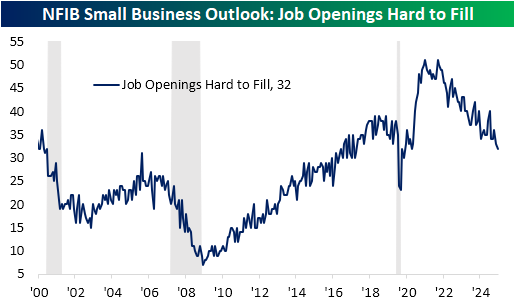

Chart of the Day – Rate Cuts In the Neighborhood of 52-Week Highs
Bespoke’s Morning Lineup – 9/9/25 – One in the Same
See what’s driving market performance around the world in today’s Morning Lineup. Bespoke’s Morning Lineup is the best way to start your trading day. Read it now by starting a two-week trial to Bespoke Premium. CLICK HERE to learn more and start your trial.
“Wrong does not cease to be wrong because the majority share in it.” – Leo Tolstoy

Below is a snippet of commentary from today’s Morning Lineup. Start a two-week trial to Bespoke Premium to view the full report.
After modest gains in US equities to start the week, futures have a positive bias this morning ahead of a relatively quiet day for economic data. The only report on the calendar is the NFIB Small Business Confidence report for August, which came in slightly better than forecasts, rising from 100.3 to 100.8.
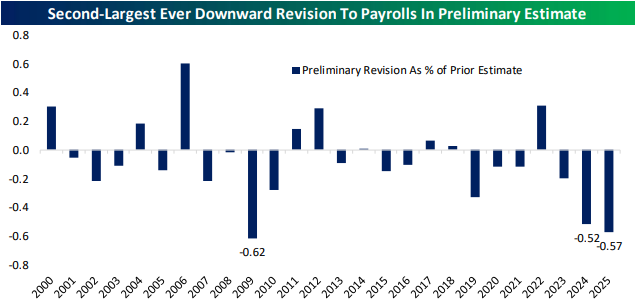
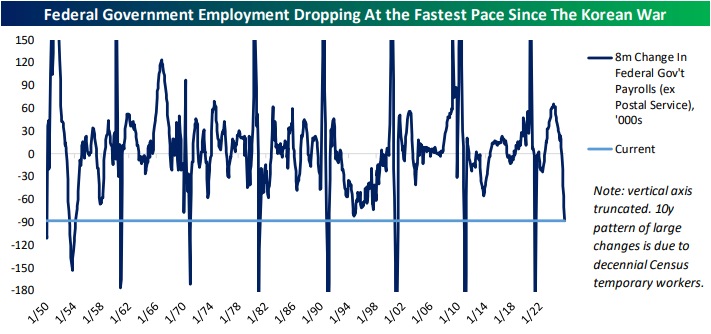
An even bigger news story today will be the Preliminary Benchmark Payrolls Revision from the BLS. While the data is even more backward-looking than most other economic data, the headline number is expected to show a large downward revision to the number of jobs created between April 2024 and March 2025. Economists forecast the downward revision to anywhere between a loss of 450K to 900K, so you can guarantee that at the very least, both sides of the political aisle will seize on the headlines.
Finally, Apple (AAPL) will hold its ‘awe-dropping’ iPhone event at 1 PM eastern, where a new line of phones, along with updated iPads, watches, and AirPods, are expected. If you didn’t see it yesterday, make sure to check out yesterday’s Chart of the Day, where we looked at the stock’s performance around prior iPhone launch events.
Besides the modestly positive tone in equities, treasury yields are slightly higher, but the 10-year is still under 4.07%, and WTI, while higher by about 1%, is still below $63 per barrel. In the metals market, performance is mixed with modest gains in gold and platinum, while silver is slightly lower. Lastly, crypto is higher across the board with Bitcoin, Ethereum, and Solana all up by close to 1%.
Outside of the US, Asian equities were mixed overnight. The Nikkei broke a streak of three straight days of at least 1%+ gains with a decline of 0.4%, while China’s Shanghai Composite fell 0.5%. European stocks are hanging on to small gains (0.14%). Germany is the biggest outlier with a decline of 0.4% while other countries in the region are offsetting those losses.
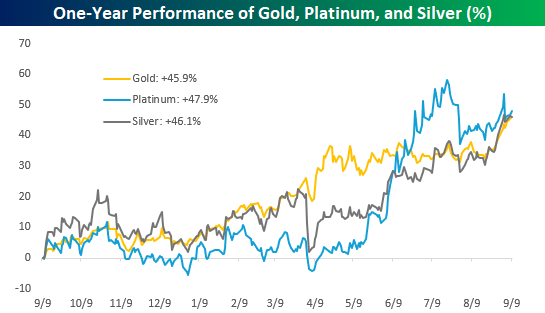
When it comes to precious metals and crypto, the first asset that immediately comes to mind for most people is gold, and given its recent performance, deservedly so. However, when you look at gold’s performance in comparison to other major precious metals like platinum and silver, their performances are nearly identical. Over the last year, gold has gained 45.9% while platinum and silver have rallied 47.9% and 46.1%, respectively. Their paths haven’t necessarily been identical, but they’ve ended up at the same place.
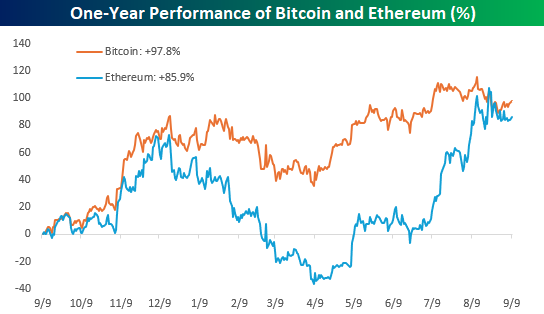
In the crypto space, Bitcoin is effectively the gold standard, and for most ‘investors’, it is the crypto market. Here again, Bitcoin’s performance hasn’t been much different than the ‘silver’ of that market – Ethereum. Here again, the paths of the two cryptos haven’t necessarily been the same, but they’ve essentially ended up at the same place. While Bitcoin is up 97.8% over the last year, Ethereum’s 85.9% gain isn’t far behind, especially for an asset class as volatile as crypto.
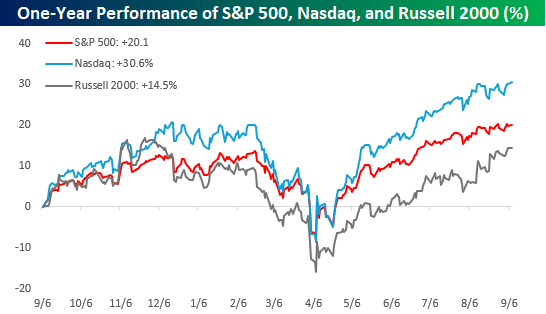
While the major metals and cryptos have had similar performances to each other over the last year, the same can’t be said for equities. While their trading patterns have been similar over the last year, the Russell 2000’s 14.5% gain comes up well short of the S&P 500’s 20.1% gain and pales in comparison to the Nasdaq’s gain of over 30%. While precious metals and, to a lesser degree, the leading cryptos have been almost interchangeable in their performance over the last year, equities, the most liquid of the three asset classes, have seen more varied returns.
The Closer – Upcoming Data, Consumer Expectations – 9/8/25
Log-in here if you’re a member with access to the Closer.
Looking for deeper insight into markets? In tonight’s Closer sent to Bespoke Institutional clients, we start with a look at this week’s upcoming data including the revisions to the payrolls number, Current Population Survey’s Annual Social and Economic Supplements, and CBO outlook (page 1). We also review some additional labor market data (page 2) before diving into the findings from the latest NY Fed Survey of Consumer Expectations (pages 3 – 6).
See today’s full post-market Closer and everything else Bespoke publishes by starting a 14-day trial to Bespoke Institutional today!
Daily Sector Snapshot — 9/8/25
Chart of the Day: A New Phone from a Now Unloved Mega-Cap
Q2 2025 Earnings Conference Call Recaps: Broadcom (AVGO)
Bespoke’s Conference Call Recaps use AI to summarize lengthy earnings calls. The commentary below is AI-generated and then edited by Bespoke for quality control. As always, none of these summaries should be construed as recommendations to buy or sell any securities, and investors should do their own research and/or consult with a financial professional before making any investment decisions.
Our latest recap available to Bespoke subscribers covers Broadcom’s (AVGO) Q3 2025 earnings call.
![]()
Broadcom (AVGO) is a semiconductor and infrastructure software giant serving hyperscale cloud providers, telecoms, enterprises, and industrial markets. On the semiconductor side, it designs and manufactures custom AI accelerators (XPUs), networking chips, broadband, storage, and wireless solutions. Its infrastructure software portfolio, bolstered by VMware, provides cloud virtualization and enterprise IT platforms. Broadcom reported record Q3 revenue of $16B, up 22% YoY, with AI semiconductors surging 63% to $5.2B. A newly qualified fourth XPU customer placed over $10B in AI rack orders, driving backlog to $110B and setting up an acceleration in FY26 growth beyond last quarter’s 50–60% outlook. Networking innovations like Tomahawk 6 and Jericho 4 Ethernet switches aim to ease bottlenecks as clusters scale past 200,000 nodes, while physical constraints (power and land) force hyperscalers into “scale-across” multi-site data centers. Non-AI semis remain sluggish, with broadband the only bright spot. VMware Cloud Foundation 9.0 has been adopted by over 90% of top VMware accounts, cementing Broadcom’s role in the private cloud shift. AVGO shares climbed as much as 16% on 9/5 in reaction to the triple play earnings report…
Continue reading our Conference Call Recap for AVGO by becoming a Bespoke Institutional subscriber. You can sign up for Bespoke Institutional now and receive a 14-day trial to read our newest Conference Call Recap. To sign up, choose either the monthly or annual checkout link below:
Q2 2025 Earnings Conference Call Recaps: Samsara (IOT)
Bespoke’s Conference Call Recaps use AI to summarize lengthy earnings calls. The commentary below is AI-generated and then edited by Bespoke for quality control. As always, none of these summaries should be construed as recommendations to buy or sell any securities, and investors should do their own research and/or consult with a financial professional before making any investment decisions.
Our latest recap available to Bespoke subscribers covers Samsara’s (IOT) Q2 2026 earnings call.
![]()
Samsara (IOT) provides a connected operations cloud that digitizes and analyzes data from physical assets like fleets, equipment, and worksites using IoT gateways, cameras, and sensors. The company serves asset-heavy industries such as transportation, construction, manufacturing, and public sector agencies, giving visibility into frontline operations. What’s impressive is Samsara’s proprietary dataset of over 20 trillion annual data points, which it combines with AI to deliver actionable insights on safety, efficiency, and sustainability. Its customers include airlines, concrete producers, utilities, municipalities, and global retailers, organizations where operational costs are both enormous and mission-critical. Samsara reported ARR of $1.64B, up 30% YoY, with $105M net-new ARR and a record 17 new $1M+ ARR customers now contributing 20% of total ARR. Management emphasized strong momentum in construction and manufacturing tied to AI infrastructure build-outs, plus accelerating wins in the public sector. Tariff-related deal delays from Q1 closed in Q2, and customers are adapting by stretching asset lifespans and optimizing utilization. AI remains central, powering features like AI Multicam and weather intelligence, while new products (asset maintenance, commercial navigation, asset tags) are gaining traction. Europe delivered its strongest ACV growth in a year, aided by local product customization. IOT reported its first triple play in a year and a half, and after a string of negative reactions to earnings, shares rallied 20% at the open on 9/5…
Continue reading our Conference Call Recap for IOT by becoming a Bespoke Institutional subscriber. You can sign up for Bespoke Institutional now and receive a 14-day trial to read our newest Conference Call Recap. To sign up, choose either the monthly or annual checkout link below: