Alone in the Red
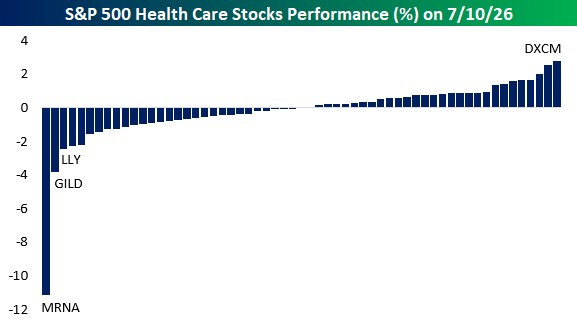
On Friday, Health Care was the only sector in the S&P 500 to close lower as the index itself rallied 0.42%. As shown in the chart below, Moderna (MRNA) led the decline, as the stock fell 11.13%. That drop was enough to make it the worst-performing stock in the S&P 500. Gilead Sciences (GILD) was the fourth-worst performer and second-worst in the sector, as it fell 3.8%. Eli Lilly (LLY), the largest Health Care company by market cap in the S&P 500, was the third-worst performer in the sector and the largest drag on the index, erasing 3.03 points on Friday.
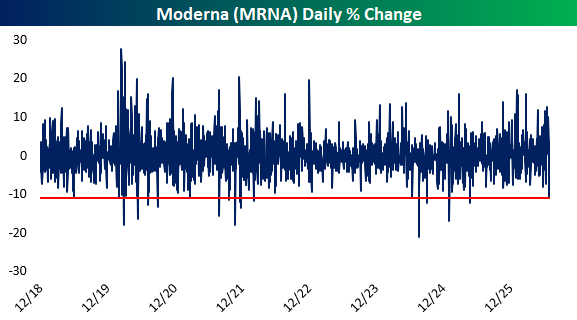
With MRNA being such a standout on Friday, it may not be surprising that the stock has only 17 worse days on record since its 2018 IPO. That puts Friday’s steep pullback among the worst 1% of all days, as shown in the chart below.
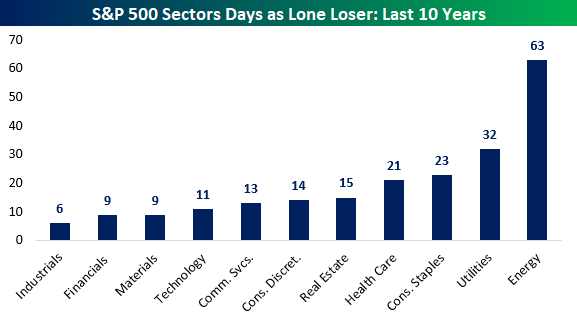
Over the last ten years, there have been 21 days when the Health Care sector has been the only sector in the red. Five of those days have come since June 2023, and the last two are within a month of each other.
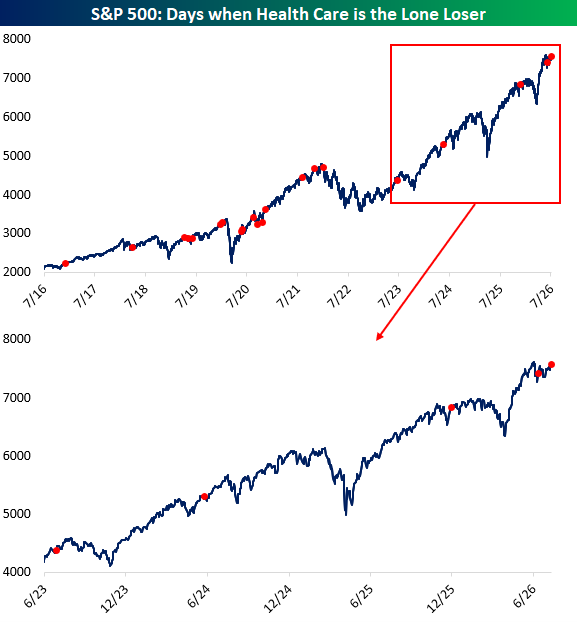
The 21 days as the lone loser is worse than seven other sectors. The sectors that have more days over that span as the only losing sector are Consumer Staples (23 days), Utilities (32 days), and Energy (63 days).
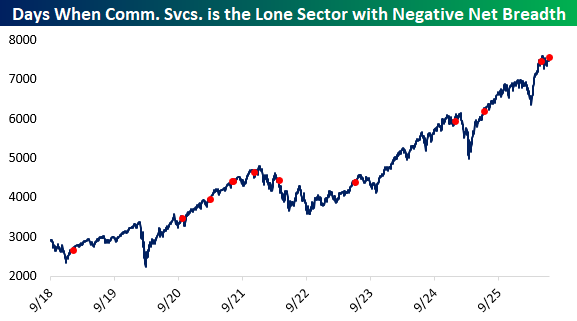
Communication Services, despite rallying 0.92% as the second-best-performing sector in the S&P 500 on Friday, was the only sector with negative daily net breadth. The daily net breadth of -4 is not out of the ordinary, but when combined with rallies of at least 0.92%, it makes up just 2.7% of all days since the sector reshuffling to include media, internet, and entertainment stocks on 9/24/2018. Since the reshuffling, there have been 11 days when Communication Services was the only sector with negative net breadth, as shown below.
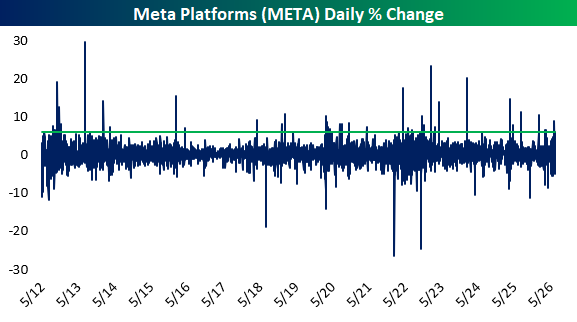
Part of the reason for the price and breadth divergence is Meta Platforms’ (META) 5.97% rally. That climb made META the top-performing stock in the S&P 500 on Friday, and also made it the second biggest positive contributor to the index as it added 10.74 points to the rally. That move also ranked in the 99th percentile of all days for the stock.
You can find more sector research like this in Bespoke’s Daily Sector Snapshot.
To read the Sector Snapshot, sign up for a free two-week Bespoke all-access trial today!
The Closer – Historically Hawkish, Technicals Turn, Positioning – 7/13/26
Log-in here if you’re a member with access to the Closer.
- Relative to a sample of Fed communications dating back to 1994, only a few could be evaluated as more hawkish than Fed Governor Waller’s speech today.
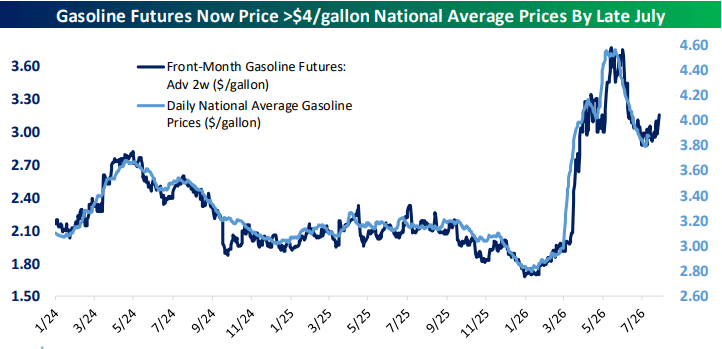
- The technicals for WTI crude oil have begun to turn around and gasoline futures are suggesting a price of $4/gallon at the pump.
- Futures positioning from CFTC data showed speculators are increasingly betting on higher rates ahead.
See today’s full post-market Closer and everything else Bespoke publishes by starting a 14-day trial to Bespoke Institutional today!
Daily Sector Snapshot — 7/13/26
Chart of the Day: Loved by Analysts, Hated by Investors
Where Will the Mega-Caps Go?
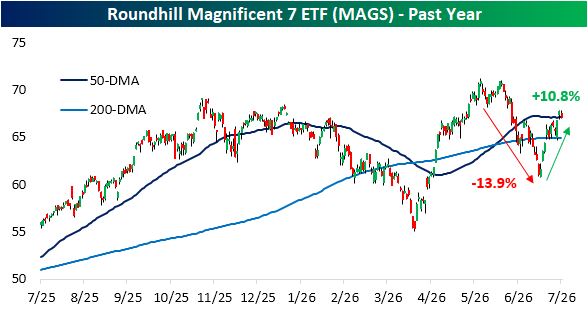
The mega-cap Mag 7 has fallen on rough times of late. The Roundhill Magnificent 7 ETF (MAGS) has been mostly rangebound since last fall apart from what was ultimately a short-lived breakout to new highs earlier this spring. More recently, a mid-May double top through the closing low on June 25th saw the ETF fall over 13% to meet the technical definition of a correction. As of Friday’s close, the ETF was up over 10% off that low, meaning it is no longer in a correction, technically speaking. However, the technicals haven’t exactly given an all clear, especially under the hood for individual members. As shown below, while Friday marked a move back above the 50-DMA, that isn’t holding in the new week.
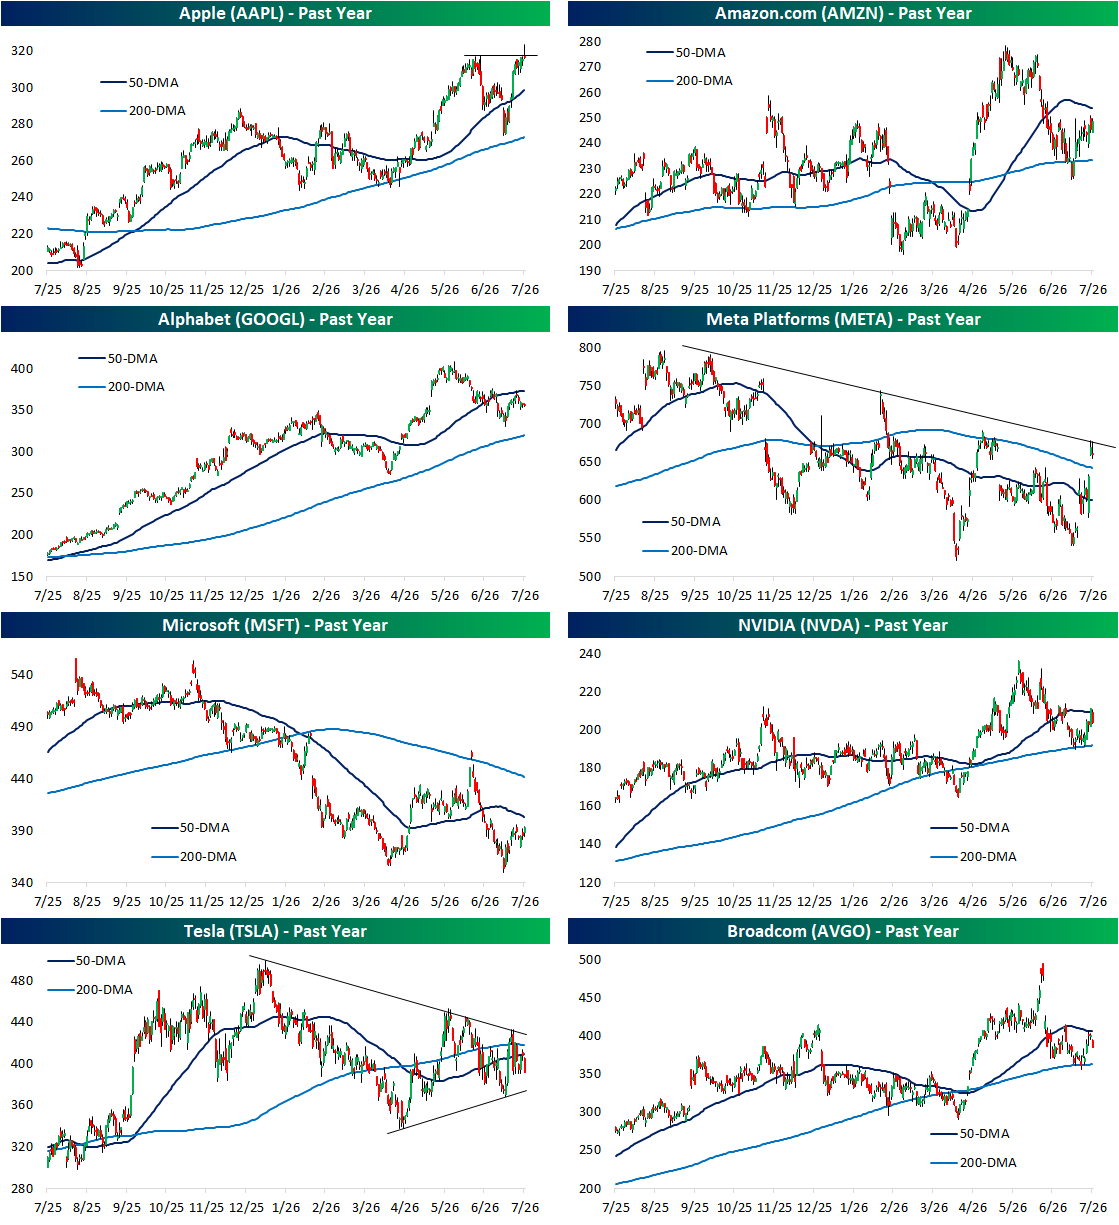
The charts of the mega-caps are showing signs of being stuck at resistance.
For starters, Apple (AAPL) and Alphabet (GOOGL) have perhaps been the strongest of the group in the past year with steady uptrends for most of that period. AAPL was the most recent to make a push back up to 52-week highs, and although it was looking like it would post another breakout earlier today when it was up 2.6% on the session, it pared those gains intraday. Meanwhile, GOOGL’s long-term uptrend is also still in tact, but it has been making lower highs lately, including one this month that simultaneously marked a rejection of the 50-DMA.
GOOGL is not the only mega-cap facing resistance at a moving average. Amazon (AMZN), Nvidia (NVDA), and Broadcom (AVGO) are all currently sandwiched between their 50-DMAs and 200-DMAs. For those two semis giants, today saw sharp rejections at the 50-DMAs.
As for the other mega-caps, the charts have gotten messy. Meta (META) recently took a big jump higher, but that gap up late last week came up short around the highs from earlier this spring in addition to the rough downtrend line off prior highs over the past year. Additionally, that move could end up reminiscent of the gap up and gap fill lower seen this past winter.
Microsoft (MSFT) also sits in a downtrend, and at the moment it is one of the few not pinging up against some sort of notable point of resistance. Granted, that also means it finds itself in no-man’s land below its 50-DMA and above the lower low set in June. Finally, we would note that Tesla (TSLA) is likewise stuck in the middle. The stock has struggled to pick a direction in the past few months as it has been swinging around its 50- and 200-DMA, making lower highs and higher lows on those swings.
Want more from Bespoke? You can start by joining our Think BIG mailing list, where you’ll receive an interesting market stat in your inbox a few times per week. All we need is your email address. Join now by clicking here or on the image below.

The Triple Play Report: 7/13/26
An earnings triple play is a stock that reports earnings and manages to 1) beat analyst EPS estimates, 2) beat analyst sales estimates, and 3) raise forward guidance. You can read more about “triple plays” at Investopedia.com where they’ve given Bespoke credit for popularizing the term. We like triple plays as an indication that a company’s business is firing on all cylinders, with better-than-expected results and an improving outlook. A triple play is indicative of positive “fundamental momentum” instead of pure fundamentals, and there are always plenty of names with both high and low valuations on our quarterly list.
Bespoke’s Triple Play Report covers what each company does, what this quarter’s results say about their growth outlooks, and their histories of delivering triple plays. Bespoke’s Triple Play Report is available at the Bespoke Institutional level only. You can sign up for Bespoke Institutional now and receive a 14-day trial to read today’s Triple Play Report. To sign up, choose either the monthly or annual checkout link below:
Bespoke Institutional – Monthly Payment Plan
Bespoke Institutional – Annual Payment Plan
Bespoke Investment Group, LLC believes all information contained in these reports to be accurate, but we do not guarantee its accuracy. None of the information in these reports or any opinions expressed constitutes a solicitation of the purchase or sale of any securities or commodities. This is not personalized advice. Investors should do their own research and/or work with an investment professional when making portfolio decisions. As always, past performance of any investment is not a guarantee of future results. Bespoke representatives or clients may have positions in securities discussed or mentioned in its published content.
Bespoke’s Morning Lineup – 7/13/26 – KOSPI Crash
See what’s driving market performance around the world in today’s Morning Lineup. Bespoke’s Morning Lineup is the best way to start your trading day. Read it now by starting a two-week trial to Bespoke Premium. CLICK HERE to learn more and start your trial.
“You will never achieve success by insuring against failure.” – Patrick Stewart

Bespoke’s Paul Hickey will be appearing on Making Money With Charles Payne today at 2 PM on Fox Business. Check it out!
Below is a snippet of commentary from today’s Morning Lineup. Start a two-week trial to Bespoke Premium to view the full report.
US equity futures are red across the board to kick off the week. The Nasdaq is on pace to gap down 1% while the S&P 500 is looking at a more modest decline of 0.35%. Factors contributing to the decline include escalating tensions between the US and Iran, as well as a plunge in South Korean stocks. Treasury yields are modestly higher, with the 10-year yielding 4.59%, while WTI rallies more than 3% to $73.80. Gold is down more than 1% and just over 1% above, breaking below $4,000 per ounce, while Bitcoin is down over 2% to $62,800.
Asian stocks mostly started the week with sharp losses. The Nikkei fell 1.9%, while the Shanghai Composite dropped slightly more at 2.1%. Neither of these, though, came close to the 9% decline in South Korea’s KOSPI. The weakness came despite data showing exports surged 54% y/y, driven by a more than tripling of semiconductors. European equities aren’t seeing nearly the magnitude of weakness that Asia experienced. The STOXX 600 is down just 0.1% while most major benchmarks trade slightly higher.
There’s little in the way of data to start the week, but action will really heat up Tuesday with June CPI, Congressional testimony from Fed Chair Warsh, and most importantly, earnings results from the major banks, including Bank of America (BAC), Citi (C), Goldman (GS), JP Morgan (JPM), and Wells Fargo (WFC).
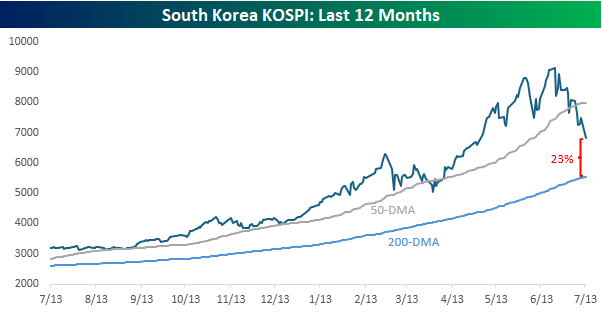
Volatility in memory stocks remains the story of the day in stock markets, and nowhere is that more on display than in South Korea’s KOSPI. The index fell nearly 9% to kick off the week as stocks like SK Hynix fell by double-digit percentages, even after Friday’s successful IPO of the company’s ADRs. Since its high three weeks ago, the KOSPI has lost more than a quarter of its value in what has been one of the largest three-week declines in the index’s history. The last time the KOSPI lost more than a quarter of its value this fast was in March 2020 during the COVID crash.
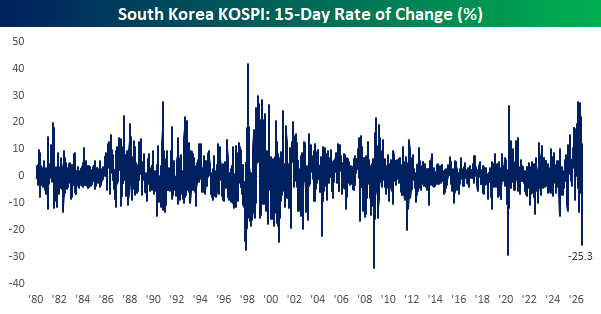
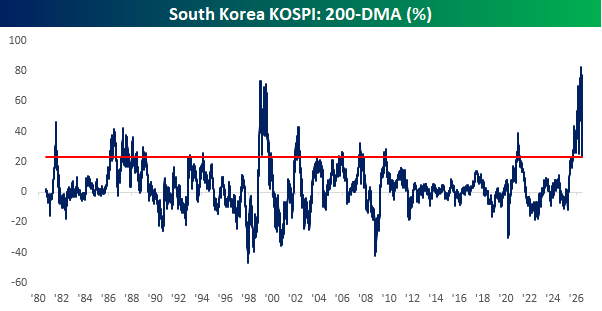
What’s amazing about this recent crash in South Korean equities is that the index is still 23% above its 200-day moving average. It’s rare to see a major international benchmark index trade well into bear market territory but still be so elevated relative to its 200-DMA.
The chart below shows the KOSPI’s 200-DMA spread going back to 1980 and shows just how extended the index had become. In early June, the South Korean benchmark was more than 80% above its 200-DMA. After the recent plunge, though, the 23% spread still ranks in the 91st percentile relative to all other periods since 1980.
Start a two-week trial to Bespoke Premium to continue reading today’s full Morning Lineup.
Brunch Reads – 7/12/26
Welcome to Bespoke Brunch Reads — a linkfest of some of our favorite articles over the past week. The links are mostly market-related, but there are some other interesting subjects covered as well. We hope you enjoy the food for thought as a supplement to the research we provide you during the week.
Disco Demolition: Disco
emerged from the dance clubs of 1970s New York, and by the end of the decade, it had moved far beyond its underground roots. Saturday Night Fever, the Bee Gees, and a flood of disco records propelled the genre into movies, radio stations, fashion, and nearly every corner of popular culture. That popularity also produced a backlash among rock fans who saw disco as artificial, overplayed, and responsible for pushing the music they liked off the air.
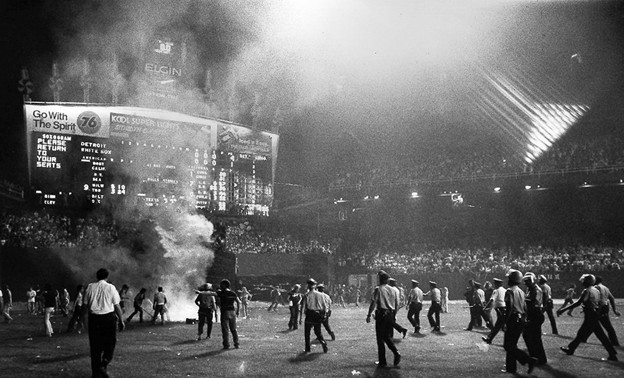
In Chicago, rock DJ Steve Dahl became the local face of that resentment after losing his job when his station changed formats to disco. Dahl, fellow broadcaster Garry Meier, and White Sox promotions director Mike Veeck devised a stunt for a July 12, 1979, doubleheader against the Detroit Tigers that allowed anyone bringing a disco record to enter Comiskey Park for 98 cents, a reference to Dahl’s station, WLUP 97.9. Organizers expected a modest boost over the team’s usual attendance of roughly 18,000, but tens of thousands of people arrived, overflowing the stadium and slipping past security. Between games, Dahl detonated a crate filled with the collected records in the outfield.
The explosion tore a hole in the grass, and thousands of fans poured onto the field, lighting fires, destroying records, stealing bases, and damaging the field while police attempted to clear the stadium. The second game could not be played, forcing the White Sox to forfeit to Detroit. The destruction wasn’t just to the diamond, either, as it’s often treated as a symbolic end for disco’s late-1970s dominance. Disco soon disappeared as a mainstream label, but its music continued and helped form the foundation of Chicago house, dance-pop, and modern electronic music.
AI & Technology
Measuring the Economic Effects of AI (Economic Innovation Group)
Estimates of how many businesses use AI range from 9% to 78%, largely because surveys define usage differently, miss tools embedded in everyday software, and vary widely in timing and sample quality. The clearest evidence so far is that AI is spreading quickly and often helps workers complete tasks rather than replacing them, but better federal surveys and linked employment data are needed to measure its true effects on jobs and productivity. [Link]
Continue reading our weekly Brunch Reads linkfest by logging in if you’re already a member or signing up for a trial to one of our two membership levels shown below! You can cancel at any time.

Daily Sector Snapshot — 7/10/26
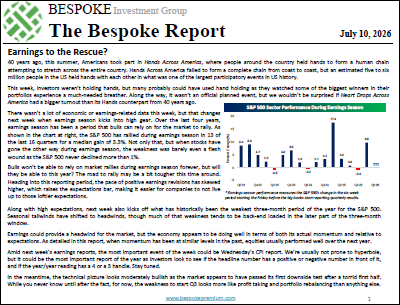
The Bespoke Report – 7/10/26 – Earnings to the Rescue?
To read our weekly Bespoke Report newsletter and access everything else Bespoke’s research platform offers, start a two-week trial to Bespoke Premium. In this week’s report we review the market’s performance to start the quarter, and then provide a big picture look at the economy and preview earnings season. Give it a read!