Chart of the Day: Microcap Rally Despite Results
B.I.G. Tips – Is Another Biotech Boom Coming?
Bespoke’s Morning Lineup – 10/9/25 – 18 Years
See what’s driving market performance around the world in today’s Morning Lineup. Bespoke’s Morning Lineup is the best way to start your trading day. Read it now by starting a two-week trial to Bespoke Premium. CLICK HERE to learn more and start your trial.
“Reality leaves a lot to the imagination.” – John Lennon

Below is a snippet of commentary from today’s Morning Lineup. Start a two-week trial to Bespoke Premium to view the full report.
Futures are flat with a negative bias this morning as the relentless rally in gold takes a pause, and oil prices see a marginal pullback. Stocks in Asia were higher overnight as China reopened for trading, and shares of Softbank surged more than 10% after announcing a deal to acquire the robotics units of ABB for $5.4 billion. In Europe, trading has been listless with the STOXX 600 down 0.04%.
The S&P 500 closed at another all-time high yesterday, just like it did 18 years ago today on 10/9/07. That new high in 2007 followed a late-summer peak-to-trough correction of nearly 12%. It was a time of stress in the financial system as the subprime housing market was in the process of imploding, but the Fed was cutting rates, and the damage ‘appeared’ contained. From a technical perspective, the S&P 500 had traded above resistance to new highs, and the 50-DMA, which has been sloping downwards, turned higher just above its 200-DMA, which was also rising. The one caveat was that the breakout to new highs wasn’t especially convincing, as the S&P 500 had only made a marginal new high.
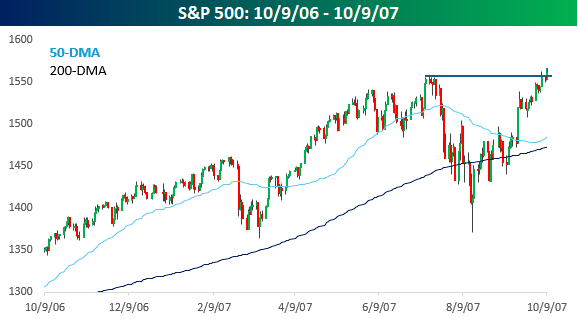
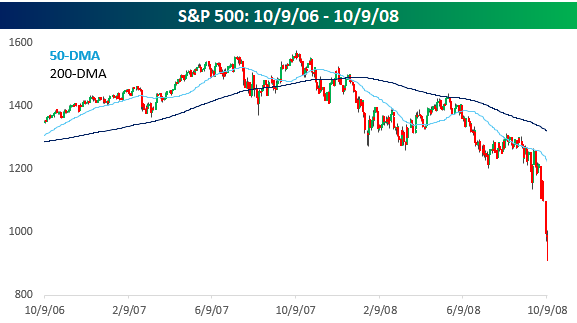
Investors breathed a sigh of relief on 10/9/07, but in the days that followed, the S&P 500 couldn’t follow through on its breakout, and within days, it was back below its summer 2007 highs. Shortly after that, the wheels came off, and the crash began. A year after the October 2007 high, the S&P 500 cratered more than 40%. As loud as the sighs of relief were in October 2007, they had nothing on VIX screamings towards 80 a year later as the entire banking system was on the verge of collapse.
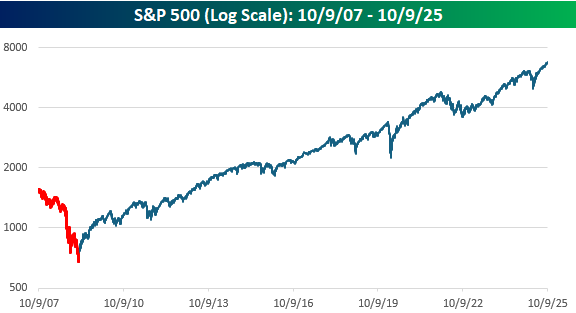
The experience of October 2007 should serve as a reminder that even in the best times, investors should always be prepared for the possibility that the light at the end of the tunnel is a freight train steaming right at us. It’s only fitting this morning that on the anniversary of the 2007 peak, JP Morgan (JPM) CEO Jamie Dimon is in the news, warning of a correction in the market at some point in the next six months to two years. At first glance, that statement seems like something you would hear coming from Captain Obvious. Of course, there will be a correction in the next six months to two years! Stock market corrections occur on average about once a year, so there may actually be two!
If you read more into Dimon’s comments, though, he’s talking more about a serious bear market than a 10% correction. Even still, six months to two years isn’t really a precise forecast. While Dimon’s comments may not be of much use to investors or traders looking for any direction on where the stock market is going, they are exactly the kind of comments you want to hear from the CEO of America’s largest bank. That’s why JP Morgan Chase is just about the only major bank where the name on the CEO’s door is the same now as it was then. Dimon has earned the right to worry!
As bad as the declines were following the October 2007 high, as we always say when it comes to the market, time heals. It took several years, but eventually the market went on to make new highs, and this morning, the S&P 500 will open more than four times higher than it was when it closed at that peak 18 years ago.
The Closer – Central Banks, Gold, Micro-Cap – 10/8/25
Log-in here if you’re a member with access to the Closer.
Looking for deeper insight into markets? In tonight’s Closer sent to Bespoke Institutional clients, we begin with a look into global push toward rate cuts in addition to the Fed minutes (page 1). We then show real gold prices and a handful of other insights on the yellow metal (pages 2 -4). We then finish with a check up on the surging performance in micro-cap stocks (page 5) and an update on crude inventories (page 6).
See today’s full post-market Closer and everything else Bespoke publishes by starting a 14-day trial to Bespoke Institutional today!
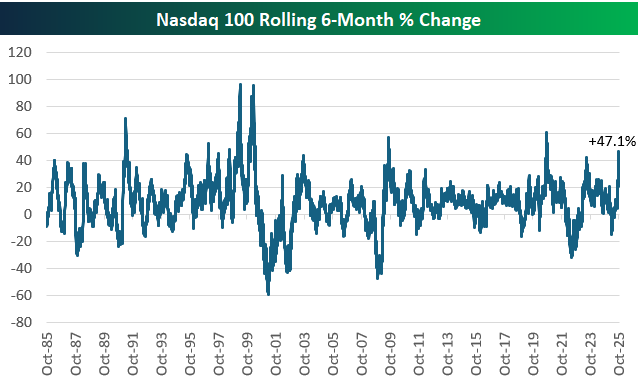
A Strong Six Months
Today marked six months since the US stock market made its “tariff crash” closing low on April 8th.
As shown below, the tech-heavy Nasdaq 100 has rallied 47.1% over the last six months. That’s definitely on the high-end for all six-month moves in the index’s history, and it’s the biggest six-month pop since the initial rally back from the COVID Crash back in early 2020.
Amazingly, in the late 1990s during the height of the Dot Com Bubble, we saw two six-month runs of nearly 100% within a year of each other in early 1999 and early 2000.
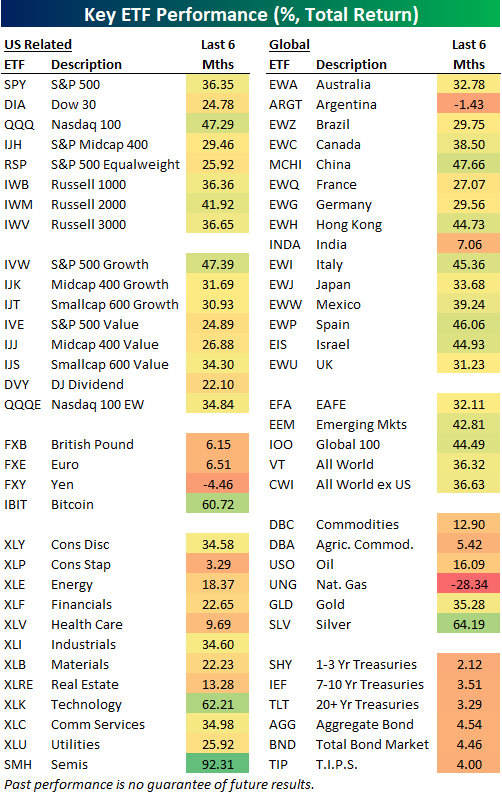
Of the major equity index ETFs in the US, the Nasdaq 100 (QQQ) has rallied the most over the last six months (+47%), while the S&P 500 (SPY) is up 36.4% and the Dow 30 (DIA) is up 24.8%. Small-caps (IWM) have rallied a solid 41.9%, while mid-caps (IJH) are up less at 29.5%.
Looking at the eleven major sector ETFs, Technology (XLK) is the only one that has done better than SPY since the 4/8 low with a gain of 62.2%. Consumer Staples (XLP) and Health Care (XLV) are both up less than 10%. Within the Tech sector, the semis (SMH) are up a remarkable 92.3%; the best performing ETF in our matrix over the last six months.
Outside of the US, plenty of country ETFs have gained 40%+ like China (MCHI), Hong Kong (EWH), Italy (EWI), Spain (EWP), and Israel (EIS). India (INDA) is up just 7.1%, while Argentina (ARGT) has actually fallen 1.4%.
Gold (GLD) has kept right up with equities since 4/8 with a gain of 35.3%. Silver (SLV) is up nearly twice as much with a gain of 64.2%, while the Bitcoin ETF (IBIT) is up 60.7%.
Across Treasury and fixed income ETFs, we’ve seen gains from 2-4.5%.

Daily Sector Snapshot — 10/8/25
What Ever Happened to Egg and Cocoa Prices?
Remember earlier in the year when rising egg and chocolate prices threatened to cancel breakfast and Valentine’s Day? In the case of eggs, retailers, who could get their hands on them, even limited the number of eggs customers could purchase. Regarding chocolate, there were stories about manufacturers reducing the number of chocolate pieces or chips they included in their various products, like ice cream and cookies. The charts below illustrate the spikes in both commodities through their highs earlier in the year, and the media ran with it, extrapolating these events to warn of impending inflation spirals in the global food chain.
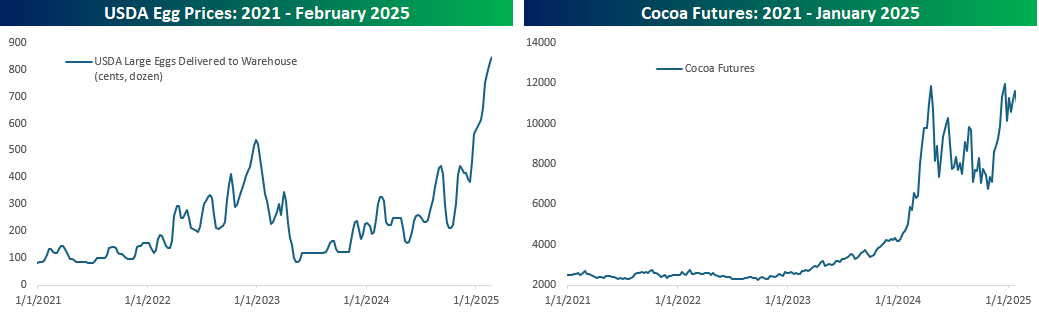
While the stories were all over business and even mainstream news earlier in the year, when was the last time you heard about egg or cocoa prices? Probably not recently, right? Have you wondered why? Maybe the updated charts below explain why. From their highs earlier in the year, egg prices have declined by 82% and cocoa prices are down by half. Given the frenzy over higher prices back then, why aren’t there as many warnings of a deflationary spiral in food prices now? When it comes to commodities, the cure for higher prices has always been higher prices.
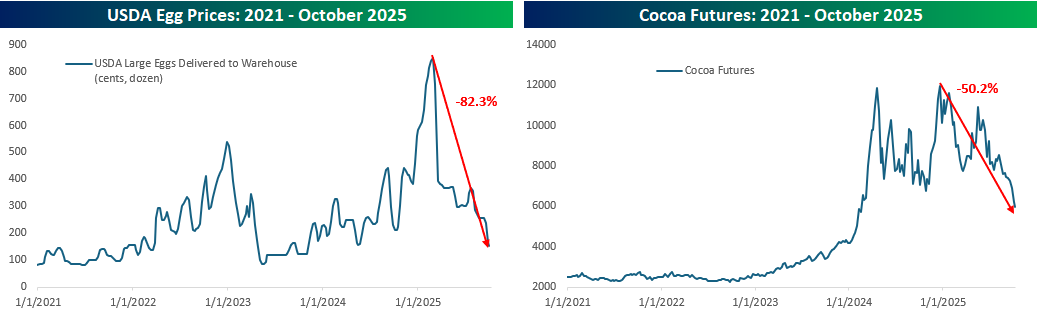
Chart of the Day: Gold Glittering
Bespoke’s Morning Lineup – 10/8/25 – Excuses, Excuses, Excuses
See what’s driving market performance around the world in today’s Morning Lineup. Bespoke’s Morning Lineup is the best way to start your trading day. Read it now by starting a two-week trial to Bespoke Premium. CLICK HERE to learn more and start your trial.
“The harder life is for a man when he is young, the easier it will be in the future.” – Aleksandr I. Solzhenitsyn
Below is a snippet of commentary from today’s Morning Lineup. Start a two-week trial to Bespoke Premium to view the full report.
After across-the-board declines yesterday, futures are looking to regroup this morning as the S&P 500 and Nasdaq are both on pace to open higher by about 0.2%. Treasury yields are modestly higher, and gold went through 4,000 like a hot knife through butter. Along with the increase in gold, other precious metals are also up even more, with platinum spiking over 2% while Palladium is up 4.5%! Even crude oil is trading higher this morning as WTI gains 1.5% to $62.70 per barrel. Finally, after a rough day in the crypto space yesterday, Bitcoin is up 1% while Ethereum is marginally higher at just under $4,500.
In Asia, China remains closed, but Japan, Hong Kong, and India are all lower after Japan’s October Tankan Index declined relative to September. In Europe, the tone is much more positive with the STOXX 600 rallying 0.7% and broad-based strength across the continent. In Germany, Industrial Production declined 4.3% m/m in August versus forecasts for a drop of just 1.0%, so whatever you think about growth in the US, Europe isn’t doing much better.
Sometimes the market moves just because investors are looking for an excuse to buy or sell. Yesterday could have been a case of the latter. The S&P 500 headed into yesterday with seven days in a row of gains, while the Nasdaq traded higher in six of the prior seven days, but those streaks didn’t even begin to illustrate how hot some sectors of the market have become, and you can’t fault investors for getting a little nervous. In fact, it’s very encouraging! Just as the quote above says, a little pain is good for the soul.
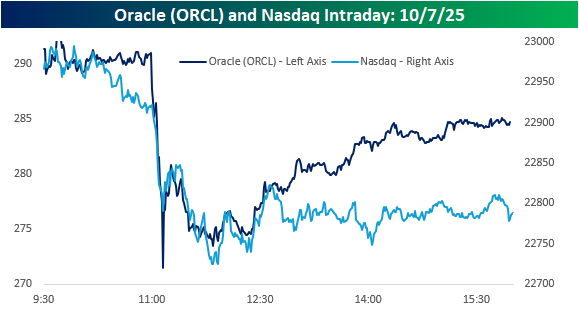
With investors already nervous, a report from The Information suggesting that margins in Oracle’s (ORCL) cloud business were thinner than expected was just the excuse they needed to take some profits. The report suggested that gross margins on the $900 million in revenue that the company generated from its Nvidia (NVDA) cloud business were just 14%, which is less than a quarter of the company’s overall gross margin of 70%.
Within minutes of the story being published, ORCL shares plunged 7% and the Nasdaq traded down over 1%. As shown in the chart below, while the magnitude of their respective moves after the report was published were different, the patterns were basically identical. Within 90 minutes, though, shares of ORCL started to rebound as “sources familiar with the situation” said The Information article was off base. By the end of the day, shares had erased more than half of their initial decline, finishing the day down 2.5%. The Nasdaq, however, didn’t bounce. While the declines didn’t intensify in the afternoon, the index finished right near where it traded after the initial release of the ORCL story.
There are multiple ways to read the divergence between ORCL and the Nasdaq intraday yesterday, and they could all be wrong. But one way to look at it is that investors looking for an excuse to take profits got just what they needed with the ORCL story, and once they rang the register, they were in no hurry to get back in. As the saying goes, “Nobody ever lost money taking a profit.”
The Closer – AI and Appetites, Sentiment, Consumers – 10/7/25
Log-in here if you’re a member with access to the Closer.
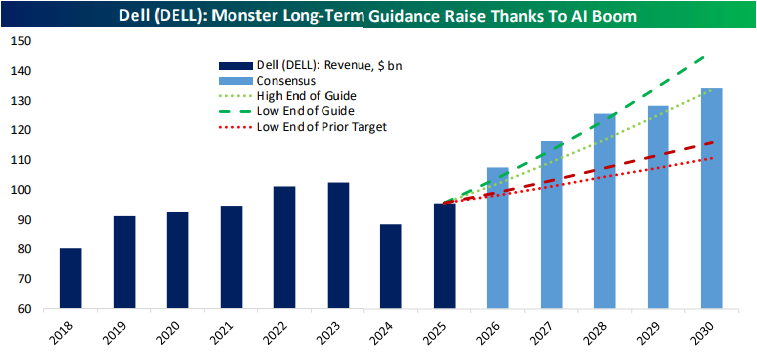
Looking for deeper insight into markets? In tonight’s Closer sent to Bespoke Institutional clients, we kick off with a look at Dell’s (DELL) AI exposure (page 1) followed by a review of the performance of quantum computing, nuclear, consumer, and travel stocks (page 2). We then switch over to investor sentiment (page 3) and next look abroad with a rundown on European auto sales (page 4). Following a recap of the latest consumer credit figures (page 5), we review the New York Fed’s Survey of Consumer Expectations (pages 6 and 7) and close out with a dive into the latest LMI report (pages 8 and 9).
See today’s full post-market Closer and everything else Bespoke publishes by starting a 14-day trial to Bespoke Institutional today!